Fig. 1
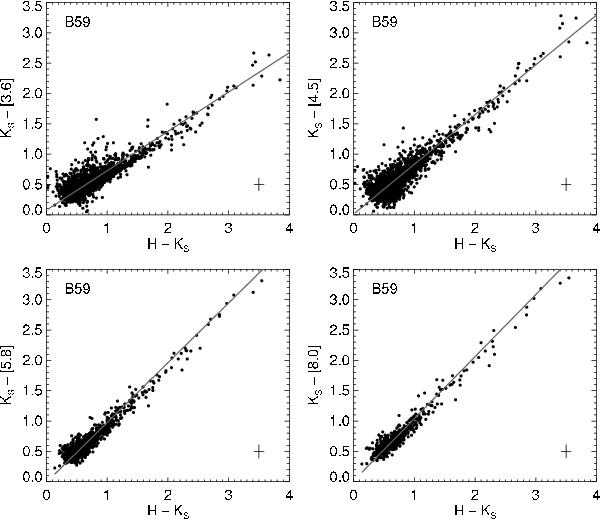
(Ks − λ) vs. (H − Ks) color-color diagrams for B59, for λ = 3.6 μm (top left), λ = 4.5 μm (top right), λ = 5.8 μm (bottom left), and λ = 8.0 μm (bottom right). The solid lines illustrate the reddening vectors for each band: the slopes are the LINES estimates, and the intercepts are such that the lines pass through the median of the distributions.
Current usage metrics show cumulative count of Article Views (full-text article views including HTML views, PDF and ePub downloads, according to the available data) and Abstracts Views on Vision4Press platform.
Data correspond to usage on the plateform after 2015. The current usage metrics is available 48-96 hours after online publication and is updated daily on week days.
Initial download of the metrics may take a while.