| Issue |
A&A
Volume 549, January 2013
|
|
|---|---|---|
| Article Number | A145 | |
| Number of page(s) | 7 | |
| Section | Stellar structure and evolution | |
| DOI | https://doi.org/10.1051/0004-6361/201220238 | |
| Published online | 15 January 2013 | |
Effects of tidally enhanced stellar wind on the horizontal branch morphology of globular clusters
1 National Astronomical Observatories/Yunnan Observatory, the Chinese Academy of Sciences, Kunming 650011, PR China
e-mail: lzx2008@ynao.ac.cn; cxf@ynao.ac.cn; zhangfh@ynao.ac.cn; zhanwenhan@ynao.ac.cn
2 Key Laboratory for the Structure and Evolution of Celestial Objects, the Chinese Academy of Sciences, Kunming 650011, PR China
3 University of the Chinese Academy of Sciences, Beijing 100049, PR China
Received: 16 August 2012
Accepted: 28 November 2012
Context. Metallicity is the first parameter to influence the horizontal branch (HB) morphology of globular clusters (GCs). It has been found, however, that some other parameters may also play an important role in affecting the morphology. While the nature of these important parameters remains unclear, they are believed to be likely correlated with wind mass-loss of red giants, since this mass loss determines their subsequent locations on the HB. Unfortunately, the mass loss during the red giant stages of the stellar evolution is poorly understood at present.
Aims. The stellar winds of red giants may be tidally enhanced by companion stars if they are in binary systems. We investigate the evolutionary consequences of red giants in binaries by including tidally enhanced stellar winds, and examine the effects on the HB morphology of GCs.
Methods. We used Eggleton’s stellar evolution code to study the binary evolution. The tidally enhanced stellar-wind model of Tout & Eggleton is incorporated into this code, where the tidal enhancement parameter, Bw, has various values (e.g., 10 000 and 500) to examine the dependency of the final results on this parameter. A Monte Carlo simulation was performed to generate a group of binary systems. The position of each primary star on the HB in the Hertzsprung-Russell diagram in this sample is obtained through interpolations among the constructed HB evolutionary tracks. Finally, a synthetic HB in the color–magnitude diagram is obtained by transforming the effective temperature and luminosity of each primary star on the HB into B − V colors and absolute magnitude.
Results. We find that red, blue, and extreme horizontal branch stars are all produced under the effects of tidally enhanced stellar wind without any additional assumptions on the mass-loss dispersion. Furthermore, the horizontal branch morphology is found to be insensitive to the tidal enhancement parameter, Bw. We compare our theoretical results with the observed horizontal branch morphology of globular cluster NGC 2808, and find that the basic morphology of the horizontal branch can be well reproduced. The number of blue horizontal branch stars in our calculations, however, is lower than that of NGC 2808.
Key words: stars: horizontal-branch / binaries: general / stars: mass-loss / globular clusters: general
© ESO, 2013
1. Introduction
For the first time, Hoyle & Schwarzschild (1955) have identified horizontal branch (HB) stars on the Hertzsprung-Russell (H-R) diagram as the progeny of red giant branch (RGB) stars. HB stars in globular clusters (GCs) are low-mass stars, which burn helium in their cores. They have different hydrogen-envelope masses, but nearly the same core mass (Iben & Rood 1970). HB stars play a very important role in many aspects of astrophysics. For instance, we can use HB stars to obtain many GC parameters, such as cluster age, helium abundance, cluster distance, etc. HB stars are also used to test stellar structure and evolution models (e.g., Renzini & Fusi Pecci 1988; VandenBerg et al. 1996). Hot HB stars and their progeny are considered to be the main contributors of ultraviolet (UV) excess emission found in early-type galaxies (e.g., Kilkenny et al. 1997; Han et al. 2007).
The color distribution of HB stars in GCs on the color–magnitude diagram (CMD), which is called HB morphology, is very different among GCs in the Milky Way. The metallicity is considered to be the most important parameter influencing the HB morphology and is called the first parameter (see Sandage & Wallerstein 1960). Metal-rich GCs have a redder HB morphology, in contrast, metal-poor GCs have a bluer morphology. It has been found, however, that metallicity cannot explain the whole HB morphology of GCs in the Milky Way. Some GCs exhibit similar metallicities, but have very different HB morphologies (e.g., M3 and M 13; Rey et al. 2001). Furthermore, some metal-rich GCs show extreme HB (EHB) stars (e.g., NGC 6388 and NGC 6441; Rich et al. 1997), which cannot be explained by the effects of metallicity only. This implies that there are some other key factors at work in addition to the metalicity that influence the HB morphology of GCs (for a recent review see Catelan 2009). These parameters are collectively known as the “second parameter” (2P). Over the past decade, many 2P candidates have been proposed, such as cluster age (Lee et al. 1994); internal rotation and helium mixing (Swigart, 1997); helium self-enrichment (D’Antona et al. 2002, 2005; D’Antona & Caloi 2004, 2008); core density or concentration (Fusi pecci et al. 1993; Buonanno et al. 1997); presence of a planetary system (Soker 1998; Soker et al. 2000, 2001, 2007); cluster mass (Recio-Blanco et al. 2006), etc. However, most of these 2P candidates are based on the single-star evolution, and none of them alone can account for the whole HB morphology in GCs.
The 2P problem in GCs is considered to be correlated with the mass loss of the RGB stars, since the position of stars on the HB in GCs is determined by their envelope mass, while the envelope mass depends on the mass loss of the RGB stars. Unfortunately, the physical mechanisms of mass loss on the RGB are poorly understood at present (Willson 2000; Dupree et al. 2009). Therefore, to reproduce different parts of the HB in GCs, most of the 2P candidates based on single-star evolution need to assume a mass-loss dispersion on the RGB (e.g., Gaussian distribution of mass for HB stars: Lee et al. 1994; D’Antona & Caloi 2004). The assumption of mass loss dispersion, however, is completely arbitrary and without physical justification.
Fusi pecci et al. (1993) and Buonanno et al. (1997) proposed that dense and concentrated environment in GCs yields a bluer and longer HB morphology. These studies implied that a stellar interactions (e.g., binary interactions) may affect the HB morphology by enhancing the mass loss of the HB progenitors. In a binary system, the primary star may fill its Roche lobe on the RGB if the orbital period is short enough. In doing so, the primary begins to steadily transfer its envelope mass to the secondary star through Roche lobe overflow (RLOF), or forms a common envelope (CE) if the mass transfer is unstable. Once the process of RLOF or CE is complete, the envelope mass of the primary star becomes very thin. If helium in the core is ignited, the primary star settles on the EHB in the H-R diagram (Han et al. 2002, 2003). However, this model can only produce EHB stars. On the other hand, although some binary systems with longer orbital periods may not fill their Roche lobe, Tout & Eggleton (1988) suggested that the companion star could tidally enhance the stellar wind of the red giant primary, and this tidally enhanced stellar wind during the binary evolution could explain the mass inversion (i.e., a more evolved star exhibits lower mass) observed in some RS CVn binaries. For this kind of situation, the primary can also lose much of its envelope mass through stellar wind and be located on a blue position of the HB after helium is ignited in its core. Under the tidally enhanced stellar wind, the envelope mass of HB stars is determined by the separation of the two companion stars in the binary system. With different initial binary orbital periods, the primary stars will lose a different envelope mass on the RGB and then be located at different places on the HB.
In this paper, we investigate the consequences of tidally enhanced stellar winds during binary evolution on enhancing the mass loss of red giants, with accompanying effects on the horizontal branch morphology of globular clusters. The RLOF and CE processes during binary evolution are not considered in this work.
The structure of this paper is as follows: in Sect. 2, we introduce the method and the numerical code. Our results and comparison with observations are presented in Sect. 3. The results are discussed in Sect. 4, and final conclusions are drawn in Sect. 5.
2. Methodology
To investigate the effects of tidally enhanced stellar winds during the binary evolution on the HB morphology of GCs, we incorporated the tidally enhanced stellar wind (described in Sect. 2.2 below) into the Eggleton’s stellar evolution code to calculate the stellar mass and the helium core mass of the primary at helium flash (hereafter MHF and Mc,HF, respectively) after experiencing mass loss on the RGB. Then, MHF, Mc,HF, together with the time spent on the HB were used to obtain the positions of the primary stars on the HB1 in H-R diagram by interpolating among the constructed HB evolutionary tracks, which are described in Sect. 3.2. Finally, we transformed the effective temperature and luminosity into B − V colors and absolute magnitude, Mv, and obtained the synthetic HB morphology in CMD, which could then be directly compared with observations.
2.1. Stellar evolution code
The original Eggleton stellar evolution code was developed four decades ago (Eggleton 1971, 1972, 1973). New physics has been added to the code by Han et al. (1994) and Pols et al. (1995, 1998). At present, the advanced stellar evolution code is being applied extensively in the field of stellar evolution.
We here incorporate the tidally enhanced stellar wind (see Sect. 2.3 below) into the Eggleton stellar evolution code to evolve the binary systems. In this code, we chose a ratio of mixing length, l, to local pressure scale-height, HP, of α = l/HP = 2.0. The convective overshooting parameter in the code, δov, is assumed to be 0.12 (Pols et al. 1997). The opacity used in our calculations is the same as that compiled by Chen & Tout (2007). We obtain the initial hydrogen mass fraction, X, using the relation X = 0.76-3Z (Pols et al. 1998), where Z is the metallicity.
2.2. Tidally enhanced stellar wind
Most binaries of RS CVn type consist of a red subgiant and an MS star. It has been found, however, that some of these systems exhibit a mass inversion phenomenon (e.g., the more evolved star has a lower mass) before the RLOF takes place (e.g., Popper & Ulrich 1977; Popper 1980). Tout & Eggleton (1988) found that the standard mass-loss rate of red giants (e.g., Reimers mass-loss rate; Reimers 1975) is too low to yield the observed mass inversion. Tout & Eggleton suggested that the secondary star may tidally enhance the stellar wind of the primary star. Since the torque due to tidal friction depends on (R/RL)6 (Zahn 1975; Campbell & Papaloizou 1983), they used the following equation to describe the tidally enhanced stellar wind of the red giant primary: ![\begin{equation} \dot{M}=-\eta4\times10^{-13}(RL/M)\left\{1+B\rm_{w}\times \rm min\left[{\it\left(R/R_{\rm L}\right)}^{6}, \rm 1/2^{6}\right]\right\}, \label{eq1} \end{equation}](/articles/aa/full_html/2013/01/aa20238-12/aa20238-12-eq14.png) (1)where η is the Reimers mass-loss efficiency (Reimers 1975), RL is the radius of Roche lobe, and Bw is the efficiency of the tidal enhancement of the stellar wind. Here R, L, and M are in solar units. Tout & Eggleton introduced a saturation for R ≥ 1/2RL in the above expression, because it is expected that the binary system is in complete corotation for R/RL ≥ 0.5. We added Eq. (1) to the Eggleton stellar evolution code to study the effects of tidally enhanced stellar wind during binary evolution on the HB morphology of GCs. The results are given in Table 1 (see Sect. 3.1).
(1)where η is the Reimers mass-loss efficiency (Reimers 1975), RL is the radius of Roche lobe, and Bw is the efficiency of the tidal enhancement of the stellar wind. Here R, L, and M are in solar units. Tout & Eggleton introduced a saturation for R ≥ 1/2RL in the above expression, because it is expected that the binary system is in complete corotation for R/RL ≥ 0.5. We added Eq. (1) to the Eggleton stellar evolution code to study the effects of tidally enhanced stellar wind during binary evolution on the HB morphology of GCs. The results are given in Table 1 (see Sect. 3.1).
Because the time that stars spent on the HB is very short (e.g., 108 years) relative to the lifetime spent on the MS (e.g., 1010 years), the initial mass of stars in a GC that resides on the HB is nearly the same (apparently, this mass depends on the age of GC). In our model calculations, the initial stellar mass of the primary star was chosen to be 0.85 M⊙, and the metallicity was set to 0.001, which is a typical value for GCs. This mass corresponds to a star age of about 11.6 Gyr at the RGB tip.
In our model calculations, we set the mass ratio of primary-to-secondary to be 1.6 (see the discussion in Sect. 4). We used the equation of Bondi & Hoyle (1944) to calculate the accretion rate from the stellar wind of the primary star onto the companion star. We chose a typical stellar wind speed of 15 km s-1 and assumed that the entire mass accreted by the secondary star from stellar wind is retained within the binary system. The angular momentum that leaves the binary system due to the stellar wind is attributed to the primary star.
2.3. Initial binary samples
To obtain the synthetic HB in CMD which can be directly compared with observations, we generated a group of binary systems. The initial stellar masses of all primary stars were chosen to be 0.85 M⊙ and the mass ratio of primary to secondary was set to be 1.6 (see Sect. 2.2). The initial binary orbital periods (or star separations) were produced by Monte Carlo simulations. The distribution of star separation in the binary system was assumed to be uniform in log a space (with a being the star separation) and falls off smoothly for low values of a (see Han et al. 2003), that is, 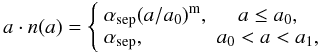 (2)where αsep ≈ 0.07, a0 = 10 R⊙, a1 = 5.75 × 10⁶ R⊙ = 0.13 pc, and m ≈ 1.2. This distribution implies that the number of wide binaries per logarithmic interval is equal, and that about 50% of the stellar systems have orbital periods shorter than 100 yr.
3. Results
3.1. Stellar mass and helium core mass of the primary at helium flash
Stellar mass and helium core mass at the stage of the helium flash (for MZAMS = 0.85 M⊙) for various initial orbital periods.
Table 1 gives MHF and Mc,HF of the primary stars at the helium flash (after mass loss experienced while on the RGB) for different initial binary orbital periods. In these calculations, the Reimers mass-loss efficiency, η, was set to be 0.25, and the tidal enhancement efficiency, Bw, was chosen to be 104 (Tout & Eggleton 1988). In the table, the columns from left to right provide the initial orbital period of the binary system, MHF, Mc,HF, respectively.
The first row of Table 1 gives the the minimum orbital period (log P/day) of the binary system above which the helium flash may take place in our calculations. For shorter periods2, the primary star may lose too much envelope mass through the tidally enhanced stellar wind, and hence its helium core is too small to ignite helium. These stars would evolve straight into helium white dwarfs (WDs), and they will not experience a helium flash; in other words, they will follow a WD cooling curve after the RGB phase.
With increasing initial orbital period, P/day, the mass loss experienced by the primary star during the RGB phase decreases. If P/day becomes long enough, the tidally enhanced stellar wind becomes unimportant and has little effect on the amount of mass loss of the primary stars on the RGB (one can see that the primary stars with an orbital period of log P/day = 4.0 and log P/day = 10.0 in Table 1 have nearly the same stellar mass at helium flash, which means that they experience nearly the same amount of mass loss on the RGB), because the separation of the two companion stars becomes too large. In this case, the primary star loses envelope mass only by means of Reimers mass loss.
The helium flash takes place at the RGB tip for binary systems with log P/day ≥ 3.26 (see Table 1). For shorter orbital periods, the primary star loses too much envelope mass and experiences a helium flash at higher temperatures on the H-R diagram. This kind of flash is called hot flash (Castellani & Castellani 1993; D’Cruz et al. 1996). It has been suggested that there are two types of hot flashes. The first type is early hot flash, for which the helium flash occurs when the star crosses the H-R diagram toward the WD cooling curves. The chemical composition of the envelope of early hot flashers is not changed by the helium flash. Stars that undergo an early hot flash are located on the blue end of the canonical EHB of the H-R diagram (e.g., see Fig. 9 in Brown et al. 2001). The second type is called late hot flash, for which the helium flash occurs on a WD cooling curve (after the primary star experiences a huge mass loss on the RGB). In this type, the helium flash can change the chemical composition of its envelope by enhancing the helium and carbon abundance through helium-flash mixing (Iben 1976; Sweigart 1997; Brown et al. 2001). Therefore, the late hot flashers have significantly higher effective temperatures on the HB, and they are fainter than the canonical EHB stars in the CMD.
The late-hot-flash model has been used to explain the existence of blue-hook stars found in several massive GCs (Whitney et al. 1998; D’Cruz et al. 2000; Brown et al. 2001). In our calculations, however, we did not consider the helium-flash mixing process. That is because the Eggleton stellar evolution code cannot pass the helium-flash phase for low-mass stars. Hence, we do not know how much helium and carbon will be mixed in the envelope during the late-hot-flash phase. For this reason, all hot flashers in our calculation are treated as early hot flashers, for which the envelope’s chemical composition remains unchanged. This assumption will not change the number of EHB stars produced in our models, and hence will not influence our final results.
3.2. HB evolutionary tracks
To obtain the position of the primary stars on the HB in the H-R diagram, we need to construct the HB evolutionary tracks. However, the Eggleton’s stellar evolution code cannot pass the helium flash stage for low-mass stars (e.g., M/M⊙ ≤ 2.0; this value is the function of metallicity). For this reason, we are only able to construct the zero-age HB (ZAHB) models using stars with greater initial masses (e.g., 2.5 M⊙). The drawback of this method is that the chemical profile of the envelope in ZAHB models constructed by massive stars is different from the one that an actual low-mass star would have had on the ZAHB3.
For the above reasons, the HB evolutionary tracks used to determine the position of a HB star in the H-R diagram are constructed using the modules for experiments in stellar astrophysics code (MESA; Paxton et al. 2011). This stellar evolution code can pass the helium-flash phase for low-mass stars, it is more physically complete, and it is convenient for constructing the ZAHB models.
HB evolutionary tracks at the ZAHB.
As seen in Table 1, the minimum and maximum stellar mass of the primary stars at the helium flash is approximately 0.47 M⊙ and 0.76 M⊙, respectively. In other words, the stellar mass of the HB stars produced by tidally enhanced stellar wind in our model calculations is in the range of 0.47 − 0.76 M⊙; hence, the stellar mass of the HB evolutionary tracks constructed to determine the positions of the primary stars on the HB in the H-R diagram is also in the same mass range.
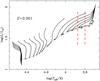 |
Fig. 1 Constructed HB evolutionary tracks. The metallicity is Z = 0.001. The HB evolution is terminated when the helium abundance drops below 0.001 at the star center. The ZAHB is shown as the dotted line at the bottom of each evolutionary track. The time interval between two adjacent + symbols in each track is 107 years. The region between the two vertical dashed red lines denotes the RR Lyrae instability strip. |
The information for the HB evolutionary tracks at the ZAHB are given in Table 2. The columns from left to right list the stellar mass (in units of M⊙), the helium core mass (in units of M⊙), the envelope mass (in units of M⊙), the star’s luminosity (in units of L⊙ and in logarithmic scale), the effective temperature, the stellar radius (in units of R⊙), and the logarithm of the gravity acceleration.
The constructed HB evolutionary tracks listed in Table 2 are shown in Fig. 1. The helium core masses of all tracks are about 0.488 M⊙ at the ZAHB, except for the first four tracks in Table 2 (corresponding to the four HB tracks that have the faintest ZAHB points in this figure). These four HB tracks are used to determine the HB positions of primary stars that undergo hot helium flash (see Sect. 3.1) and have smaller helium core masses at ZAHB than those of primary stars undergoing helium flash at the RGB tip. The time interval between two adjacent + symbols on each track is 107 years. The HB evolution is terminated when the central helium abundance by mass fraction has dropped below 0.001. The RR Lyrae instability strip is marked by the two vertical dashed red lines in Fig. 1, which is used to distinguish between the blue and the red HB stars in GCs, and it is defined by the vertical region: 3.8 < log Teff < 3.875 on the H-R diagram in this paper (see Koopmann et al. 1994; Lee et al. 1990).
3.3. Obtaining the positions of HB stars in the H-R diagram
To obtain the position of each primary star of our binary samples on the HB in the H-R diagram, we need to know MHF, Mc,HF and the time spent on the HB. The MHF and Mc,HF for each primary star are obtained by interpolating with the results in Table 1. The time spent on the HB is generated by a uniform random number between 0 and the lifetime of the HB, τHB. Here, τHB is set to be the lifetime of an HB star with the lowest stellar mass among the HB evolutionary tracks (i.e., 0.47 M⊙) in Table 2, which means that this star has the longest lifetime on the HB. Therefore, some of the HB stars are given a time longer than their lifetime on the HB, and these stars are considered to have evolved into the next evolutionary phase (e.g., AGB or WD). This is equivalent to the scenario that RGB stars enter the HB at a constant rate (see Lee et al. 1990). Using MHF, Mc,HF, and the time spent in the HB phase for HB stars, we obtain the position of each primary star on the HB (e.g., effective temperatures and luminosities) in the H-R diagram by interpolating among the HB evolutionary tracks shown in Fig. 1.
As seen in Table 1, primary stars with short orbital periods (e.g., log P/day < 3.26 in Table 1) lose a substantial amount of envelope mass (approximately 40%) through the powerful tidally enhanced stellar wind. Thus, they leave the RGB after experiencing a huge mass loss, and undergo hot helium flashes at higher temperatures (see Sect. 3.1 above). These stars have lower helium core masses than the stars that undergo the helium flash at the tip of the RGB (about 0.488 M⊙ in our model calculations; see Table 1). Therefore, in our model calculations, the core masses of stars undergoing hot helium flashes are in the range between the minimum core mass required for the helium flash (i.e., 0.4706 M⊙; see Table 1) and 0.488 M⊙. We find, however, that the corresponding envelope masses are nearly the same (0.001 M⊙; see Table 1). For this reason, the positions of the hot flash stars on the HB in H-R diagram are obtained by interpolating their core masses using the first five HB evolutionary tracks given in Table 2. We find that stars that undergo a normal helium flash at the RGB tip have nearly the same helium core mass of approximately 0.488 M⊙. Therefore, the locations of these stars on the HB in the H-R diagram are obtained by interpolating among the remaining HB evolutionary tracks given in Table 2 using the envelope mass.
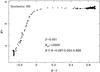 |
Fig. 2 Synthetic HB morphology for Z = 0.001 and Bw = 104. Here, B, V, and R are the numbers of HB stars located to the left (bluer), within, and to the right (redder) of the RR Lyrae instability strip. The HB stars within the RR Lyrae instability strip are denoted by asterisks, whereas the other HB stars are denoted by dots. |
3.4. Synthetic HB morphology in CMD
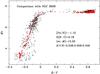 |
Fig. 3 Comparison of our synthetic HB with the observed HB morphology for globular cluster NGC 2808. The basic parameters of NGC 2808 are as labeled. The number ratio of stars, B:V:R, in different parts of the HB for this cluster derived from observations are also shown. The black + in this figure denote the observational data of HB stars for this GC. The red dots and the red asterisks denote the synthetic HB stars obtained from our model calculations, as in Fig. 2. The photometric data for NGC 2808 are taken from Piotto et al. (2002). |
To compare our results directly with observations, we transformed for each primary star in our binary samples the effective temperature and luminosity on the HB into B − V colors and absolute magnitude, Mv, respectively, using the stellar spectra library compiled by Lejeune et al. (1997, 1998). Figure 2 shows a synthetic HB in CMD under the tidally enhanced stellar wind. In this figure, the HB stars located within the RR Lyrae instability strip are denoted by asterisks, and the other HB stars are denoted by dots. The legend in Fig. 2 shows the number ratio of stars in different parts of the HB:B:V:R, where B, V, and R are the numbers of HB stars that are bluer than (or to the left of), within, and redder than (or to the right of) the RR Lyrae instability strip (Lee et al. 1990).
In Fig. 2, our model calculations reproduce the red, blue, and extreme HB stars. We find that about 90% of stars shown in Fig. 2 are red HB stars, and that about 10% of stars are blue HB and EHB stars. There are only a few stars located within the RR Lyrae instability strip. The results shown in the figure demonstrate that we are capable of reproducing the basic HB morphology by considering tidally enhanced stellar winds only, and without making any assumption of mass-loss dispersion on the RGB. This result is consistent with our expectation that different initial orbital periods of the binaries yield different mass losses on the RGB, and hence different positions on the HB.
3.5. Model comparison with observations for GC NGC 2808
NGC 2808 is a typical GC for which the 2P problem exists, which is why it has been studied extensively by various researchers. The cluster has an intermediate metallicity of about Z = 0.0014 (or [Fe/H] = –1.15; Harris 1996), and its age is in the range of 10.4 − 12.9 Gyr (Gratton et al. 2010). The cluster, however, exhibits a bimodal HB morphology (i.e., red, blue, and extreme HB are well populated, with a few stars in the RR Lyrae instability strip; Bedin et al. 2000; Piotto et al. 2002). Over the years, several 2P candidates have been proposed for this cluster (e.g., age, helium enhancement, etc. D’Antona & Caloi 2004, 2008). None of them alone, however, can successfully explain the HB morphology of NGC 2808.
Since the metallcity and the age used in our model calculations are very similar to those for NGC 2808, we can directly compare between our synthetic HB and the observed HB in this cluster. The results of this comparison are shown in Fig. 3. The photometric data for NGC 2808 adopted in our study were obtained by Piotto et al. (2002) with the HST/WFPC2 camera in the F439W and F555W bands. The distance module for the cluster is 15.25 and the reddening correction is 0.18 (Bedin et al. 2000; D’Antona & Caloi 2004). In the observational data of Piotto et al. (2002), about 46% of the HB stars in the cluster are red HB stars, and the other 54% of the HB stars are located in the region that is bluer than the RR Lyrae instability strip.
In Fig. 3, we combine our synthetic HB with the observed HB morphology for globular cluster NGC 2808. The black + symbols correspond to the observed HB stars for the cluster. The red dots and the red asterisks denote the synthetic HB stars, as in Fig. 2. Figure 3 demonstrates that by considering only tidally enhanced stellar winds as the 2P, we can successfully reproduce the basic HB morphology of NGC 2808 (without making any assumption for the mass-loss dispersion on the RGB at all). Red, blue, and extreme HB are present both in the synthetic HB and in the observed one for NGC 28084. Furthermore, we successfully reproduce the gap between the red and the blue HB stars for the cluster.
We find, however, that the number ratio of stars for different parts of the HB, B:V:R, is very different for the synthetic HB and the real HB for NGC 2808. It turns out that only about 10% of the HB stars are located in the blue and the extreme HB (as opposed to 54% in the real data), and about 90% of the HB stars are red HB stars in our synthetic HB results (versus 46% in the real data). This means that the HB stars in the region bluer than the RR Lyare instability strip are underrepresented in our model calculations. Dynamical interactions could partly alleviate this problem. Globular clusters provide a good environment for dynamical interactions due to their high density. These interactions may enhance the mass loss of the HB progenitors, e.g., by close encounters of red giant stars with main-sequence stars or compact objects (Moehler 2010). Some observations seem to support this. Fusi pecci et al. (1993) claimed that more concentrated or more dense clusters have a bluer and longer HB morphology. Buonanno et al. (1997) demonstrated that the higher the central density of the cluster, the higher the relative number of stars that populate the most bluest region of the HB. However, the exact dynamical mechanism for the enhancement of mass loss remains unclear. Furthermore, we do not know the real initial orbital-period distribution for binary systems in GCs at present, which may also impact our model calculations results. Investigating the impact of these effects, however, was beyond the scope of the present work, and it will be the subject of a follow-up study.
In Fig. 3, one can see that our synthetic EHB stars cannot reach the faintest HB stars observed in NGC 2808. The latter are blue-hook stars, as discussed in Sect. 3.1, which correspond to a higher effective temperature than the canonical EHB stars. Brown et al. (2001) have suggested that these stars undergo a late hot helium flash while descending along one of the WD cooling curves. The helium and carbon abundance in the envelope of these stars are enhanced by the helium flash mixing, which is not considered in our model calculations (see discussion in Sect. 3.1). That is the main reason why our synthetic EHB stars cannot reach the faintest HB stars observed in NGC 2808. Our model results, however, demonstrate that tidally enhanced stellar winds during binary evolution can explain the anomalous mass loss while on the RGB, which is required to explain the existence of blue-hook stars in GCs.
4. Discussion
We have proposed that tidally enhanced stellar wind in binary evolution may influence the HB morphology in GCs, and we showed that we can produce the red, blue, and extreme HB stars without any additional assumption of mass-loss dispersion on the RGB. This is the largest advantage that distinguish our models from other 2P candidates that were based on the single-star evolution. Although recent observations revealed that the fraction of binary systems in GCs (Sollima et al. 2007; Dalessandro et al. 2011) is low compared to the population of isolated stars, this does not mean that binaries are not important for the evolution of GCs. On the contrary, it is well known, for example, that dynamical interactions in GCs can destroy binary systems; i.e., soft binaries can be easily disrupted by any strong encounters. The binary evolution can also lead to their disruption (e.g., supernova explosions, star mergers, etc.). Furthermore, Ivanova et al. (2005) have suggested that, to explain the currently observed low fraction of binary systems in cluster cores, the initial ratio of stars in binaries to all stars in GCs should be very high (even close to 100%). This means that the population of binary systems is much higher when a GC is formed, and that binaries may play an important role in the evolution of GCs.
To investigate the effects of the tidal enhancement parameter, Bw, on the HB morphology, we reduced this parameter 20 fold, and the corresponding results for the synthetic HB CMD are shown in Fig. 4. All other model parameters remain the same as in Fig. 2. By comparing Fig. 2 with Fig. 4, one can see that although Bw is 20 times different between the two cases, the corresponding HB morphology is nearly identical for the two cases: the red, blue, and extreme HB stars are clearly reproduced in both cases, and the number ratio of stars at different parts of the HB is very similar. As in Fig. 2, in Fig. 4 we find that about 91% of the HB stars are red HB stars, and that 8% of the HB stars are blue HB and EHB stars. Furthermore, in both cases there are only a few HB stars located within the RR Lyrae instability strip. This comparison demonstrates that the HB morphology is not very sensitive to the tidal enhancement parameter, Bw.
The mass ratio of primary-to-secondary in this work is 1.6, but we also adopted several different mass ratios of primary-to-secondary (namely, 1.2, 1.6, and 2.5) in our model calculations, but we found that this mass ratio has little influence on our final results.
The metallicity in our model calculations is Z = 0.001, which is a typical value for GCs. We also performed calculations for metallicity value 20 times higher (i.e., Z = 0.02) to investigate its impact on the results. We found that even for this high value of the metallicity, the blue and extreme HB stars can still be produced. That is because the initial orbital periods of some binary systems are short, and so the primary stars in these binaries can lose much of their envelope mass due to tidally enhanced stellar winds. Thus, our model can be applied to explain the formation of extended HBs, which are found in some metal-rich GCs, such as NGC 6388 and NGC 6441 (Rich et al. 1997).
5. Conclusions
The purpose of the present study was to investigate the effects of tidally enhanced stellar winds during the binary evolution on the HB morphology of GCs. We found that, with the tidally enhanced stellar wind, red, blue, and extreme HB stars are all produced in our synthetic HB, and the HB morphology is not very sensitive to the tidal enhancement parameter, Bw. Furthermore, we compared the synthetic HB with the observed one in the GC NGC 2808. We found that the basic HB morphology of NGC 2808 can be reproduced well in our models, which use only the tidally enhanced stellar winds as the 2P, and without making any assumption on the mass-loss dispersion on the RGB. Moreover, we successfully reproduced the gap between the red and the blue HB stars for this cluster. However, the number ratio of stars for different parts of the HB, namely B:V:R, is very different between our synthetic HB and the observed HB in NGC 2808: only about 10% of the HB stars are located in the blue and the extreme HB (as opposed to 54% in the real data), and about 90% of the HB stars are red HB stars in our synthetic HB (versus 46% in the real data). This implies that fewer HB stars in the region bluer than the RR Lyrae instability strip are produced in our model calculations compared to the real one in NGC 2808.
One can see in Fig. 3 that the blue HB stars present an enormous spread of magnitude at a given color (e.g., the scatter in MV appears to be about 3 mag) in this cluster. This is due to not only the decreasing sensitivity of B − V colors to temperatures but also to the increasing bolometric correction for hotter stars, i.e., the maximum of stellar flux is radiated at ever shorter wavelengths for increasing temperatures, making stars fainter at V (Moehler 2010).
Acknowledgments
It is a pleasure to thank the referee, Peter Eggleton for his valuable suggestions and comments, which improved the paper greatly. The authors would like to thank Ilia Roussev for his constructive comments made towards improving the quality of this manuscript. This work is supported by the National Natural Science Foundation of China (Grant Nos. 11033008, 10973036, 11173055 and 11273053) and the Chinese Academy of Sciences (Grant No. KJCX2-YW-T24).
References
- Bondi, H., & Hoyle, F. 1944, MNRAS, 104, 273 [NASA ADS] [CrossRef] [Google Scholar]
- Brown, T. M., Sweigart, A. V., Lanz, T., Landsman, W. B., & Hubeny, I. 2001, ApJ, 562, 368 [NASA ADS] [CrossRef] [Google Scholar]
- Buonanno, R., Corsi, C., Bellazzini, M., Ferraro, F. R., & Fusi Pecci, F. 1997, AJ, 113, 706 [NASA ADS] [CrossRef] [Google Scholar]
- Campbell, C. G., & Papaloizou, J. 1993, MNRAS, 204, 433 [NASA ADS] [Google Scholar]
- Castellani, M., & Castellani, V. 1993, ApJ, 407, 649 [NASA ADS] [CrossRef] [Google Scholar]
- Catelan, M. 2009, Ap&SS, 320, 261 [NASA ADS] [CrossRef] [Google Scholar]
- Chen, X. F., & Tout, C. A. 2007, Chin. J. Astron. Astrophys., 7, 245 [NASA ADS] [CrossRef] [Google Scholar]
- Dalessandro, E., Lanzoni, B., Beccari, G., et al. 2011, ApJ, 743, 11 [NASA ADS] [CrossRef] [Google Scholar]
- D’Antona, F., & Caloi, V. 2004, ApJ, 611, 871 [NASA ADS] [CrossRef] [Google Scholar]
- D’Antona, F., & Caloi, V. 2008, MNRAS, 390, 693 [NASA ADS] [CrossRef] [Google Scholar]
- D’Antona, F., Caloi, V., Montalbán, J., Ventura, P., & Gratton, R. 2002, A&A, 395, 69 [NASA ADS] [CrossRef] [EDP Sciences] [Google Scholar]
- D’Antona, F., Bellazzini, M., Caloi, V., et al. 2005, ApJ, 631, 868 [NASA ADS] [CrossRef] [Google Scholar]
- D’Cruz, N. L., Dorman, B., Rood, R. T., & O’Connell, R. W. 1996, ApJ, 466, 359 [NASA ADS] [CrossRef] [Google Scholar]
- D’Cruz, N. L., O’Connell, R. W., Rood, R. T., et al. 2000, ApJ, 530, 352 [NASA ADS] [CrossRef] [Google Scholar]
- Dupree, A. K., Smith, G. H., Strader, J., et al. 2009, AJ, 138, 1485 [NASA ADS] [CrossRef] [Google Scholar]
- Eggleton, P. P. 1971, MNRAS, 151, 351 [NASA ADS] [CrossRef] [Google Scholar]
- Eggleton, P. P. 1972, MNRAS, 156, 361 [NASA ADS] [Google Scholar]
- Eggleton, P. P. 1973, MNRAS, 163, 279 [NASA ADS] [CrossRef] [Google Scholar]
- Fusi Pecci, F., Ferraro, F. R., Bellazzini, M., et al. 1993, AJ, 105, 1145 [NASA ADS] [CrossRef] [Google Scholar]
- Gratton, R. G., Carretta, E., Bragaglia, A., Lucatello, S., & D’Orazi, V. 2010, A&A, 517, A8 [NASA ADS] [CrossRef] [EDP Sciences] [Google Scholar]
- Han, Z., Podsiadlowski, P., & Eggleton, P. P. 1994, MNRAS, 270, 121 [NASA ADS] [CrossRef] [Google Scholar]
- Han, Z., Podsiadlowski, Ph., Maxted, P. F. L., Marsh, T. R., & Ivanova, N. 2002, MNRAS, 336, 449 [NASA ADS] [CrossRef] [Google Scholar]
- Han, Z., Podsiadlowski, Ph., Maxted, P. F. L., & Marsh, T. R. 2003, MNRAS, 341, 669 [NASA ADS] [CrossRef] [Google Scholar]
- Han, Z., Podsiadlowski, P., & Lynas-Gray, A. E. 2007, MNRAS, 380, 1098 [NASA ADS] [CrossRef] [Google Scholar]
- Harris, W. E. 1996, AJ, 112, 1487 [NASA ADS] [CrossRef] [Google Scholar]
- Hoyle, F., & Schwarzschild, M. 1955, ApJS, 2, 1 [NASA ADS] [CrossRef] [Google Scholar]
- Iben, I. Jr. 1976, ApJ, 208, 165 [NASA ADS] [CrossRef] [Google Scholar]
- Iben, I. Jr., & Rood, R. T. 1970, ApJ, 161, 587 [NASA ADS] [CrossRef] [Google Scholar]
- Ivanova, N., Belczynski, K., Fregeau, J. M., & Rasio, F. A. 2005, MNRAS, 358, 572 [NASA ADS] [CrossRef] [MathSciNet] [Google Scholar]
- Kilkenny, D., Koen, C., O’Donoghue, D., et al. 1997, MNRAS, 285, 640 [Google Scholar]
- Koopmann, R. A., Lee, Y. W., Demarque, P., et al. 1994, ApJ, 423, 380 [NASA ADS] [CrossRef] [Google Scholar]
- Lee, Y. W., Demarque, P., & Zinn, R. 1990, ApJ, 350, 155 [NASA ADS] [CrossRef] [Google Scholar]
- Lee, Y. W., Demarque, P., & Zinn, R. 1994, ApJ, 423, 248 [Google Scholar]
- Moehler, S. 2010, MmSAI, 81, 838 [NASA ADS] [Google Scholar]
- Paxton, B., Bildsten, L., Dotter, A., et al. 2011, ApJS, 192, 3 [Google Scholar]
- Piotto, G., King, I. R., Djorgovski, S. G., et al. 2002, A&A, 391, 945 [NASA ADS] [CrossRef] [EDP Sciences] [Google Scholar]
- Piotto, G., Bedin, L. R., Anderson, J., et al. 2007 ApJ, 661, L53 [NASA ADS] [CrossRef] [Google Scholar]
- Pols, O. R., Tout, C. A., Eggleton, P. P., & Han, Z. 1995, MNRAS, 274, 964 [NASA ADS] [CrossRef] [Google Scholar]
- Pols, O. R., Tout, C. A., Schröder, K. P., et al. 1997, MNRAS, 289, 869 [NASA ADS] [CrossRef] [Google Scholar]
- Pols, O. R., Schröder, K. P., Hurley, J. P., et al. 1998, MNRAS, 298, 525 [NASA ADS] [CrossRef] [Google Scholar]
- Popper, D. M. 1980, ARA&A, 18, 115 [NASA ADS] [CrossRef] [Google Scholar]
- Popper, D. M., & Ulrich, R. K., ApJ, 212, L131 [Google Scholar]
- Recio-Blanco, A., Aparicio, A., Piotto, G., De Angeli, F., & Djorgovski, S. G. 2006, A&A, 452, 875 [NASA ADS] [CrossRef] [EDP Sciences] [Google Scholar]
- Reimers, D. 1975, MSRSL, 8, 369 [Google Scholar]
- Renzini, A., & Fusi Pecci, F. 1988, ARA&A, 26, 245 [NASA ADS] [CrossRef] [Google Scholar]
- Rey, S. C., Yoon, S. J., & Lee, Y. W. 2001, ApJ, 122, 3219 [Google Scholar]
- Rich, R. M., Sosin, C., Dforgovski, S. G., et al. 1997, ApJ, 484, L25 [Google Scholar]
- Sandage, A., & Wallerstein, G. 1960, ApJ, 131, 598 [NASA ADS] [CrossRef] [Google Scholar]
- Soker, N. 1998, AJ, 116, 1308 [NASA ADS] [CrossRef] [Google Scholar]
- Soker, N., & Hadar, R. 2001, MNRAS, 324, 213 [NASA ADS] [CrossRef] [Google Scholar]
- Soker, N., & Harpaz, A. 2000, MNRAS, 317, 861 [NASA ADS] [CrossRef] [Google Scholar]
- Soker, N., & Harpaz, A. 2007, ApJ, 660, 699 [NASA ADS] [CrossRef] [Google Scholar]
- Sollima, A., Beccari, G., Ferraro, F. R., Fusi Pecci, F., & Sarajedini, A. 2007, MNRAS, 380, 781 [NASA ADS] [CrossRef] [Google Scholar]
- Sweigart, A. V. 1997, ApJ, 474, L23 [NASA ADS] [CrossRef] [Google Scholar]
- Tout, C. A., & Eggleton, P. P. 1988, MNRAS, 231, 823 [NASA ADS] [CrossRef] [Google Scholar]
- VandenBerg, D. A., Stetson, P. B., & Bolte, M. J. 1996, ARA&A, 34, 461 [NASA ADS] [CrossRef] [Google Scholar]
- Whitney, J. H., Rood, R. T., O’Connell, R. W., et al. 1998, ApJ, 495, 284 [NASA ADS] [CrossRef] [Google Scholar]
- Willson, L. A. 2000, ARA&A, 38, 573 [NASA ADS] [CrossRef] [Google Scholar]
- Zahn, J. -P. 1975, A&A, 57, 383 [Google Scholar]
All Tables
Stellar mass and helium core mass at the stage of the helium flash (for MZAMS = 0.85 M⊙) for various initial orbital periods.
All Figures
|
Fig. 1 Constructed HB evolutionary tracks. The metallicity is Z = 0.001. The HB evolution is terminated when the helium abundance drops below 0.001 at the star center. The ZAHB is shown as the dotted line at the bottom of each evolutionary track. The time interval between two adjacent + symbols in each track is 107 years. The region between the two vertical dashed red lines denotes the RR Lyrae instability strip. |
| In the text | |
|
Fig. 2 Synthetic HB morphology for Z = 0.001 and Bw = 104. Here, B, V, and R are the numbers of HB stars located to the left (bluer), within, and to the right (redder) of the RR Lyrae instability strip. The HB stars within the RR Lyrae instability strip are denoted by asterisks, whereas the other HB stars are denoted by dots. |
| In the text | |
|
Fig. 3 Comparison of our synthetic HB with the observed HB morphology for globular cluster NGC 2808. The basic parameters of NGC 2808 are as labeled. The number ratio of stars, B:V:R, in different parts of the HB for this cluster derived from observations are also shown. The black + in this figure denote the observational data of HB stars for this GC. The red dots and the red asterisks denote the synthetic HB stars obtained from our model calculations, as in Fig. 2. The photometric data for NGC 2808 are taken from Piotto et al. (2002). |
| In the text | |
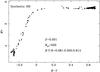 |
Fig. 4 Same as in Fig. 2, but for Bw = 500. |
| In the text | |
Current usage metrics show cumulative count of Article Views (full-text article views including HTML views, PDF and ePub downloads, according to the available data) and Abstracts Views on Vision4Press platform.
Data correspond to usage on the plateform after 2015. The current usage metrics is available 48-96 hours after online publication and is updated daily on week days.
Initial download of the metrics may take a while.