Fig. 6
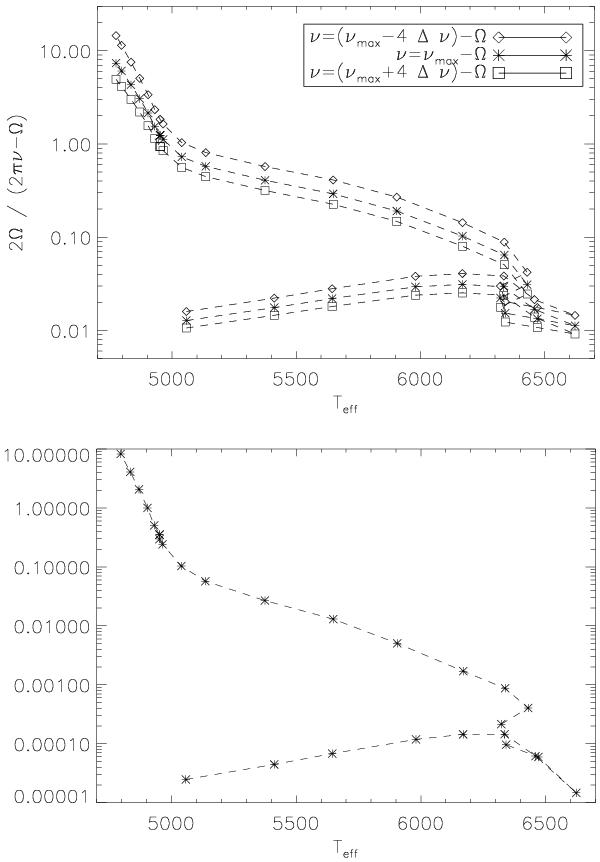
Evolution of the parameters ζ, Eq. (25) (top) and Δ, Eq. (28) (bottom), with the effective temperature of the model along its evolution from the PMS to the RGB. To be conservative, the layer where Ω is maximum is considered for ζ and the layer where the gradient is maximum is chosen for computing Δ. For ζ, we used m = −1, since ζ is higher for prograde modes, while for Δ we considered m = 1 as no difference is found for m = −1 due to the fact that Ω ≪ ω where Δ is maximum.
Current usage metrics show cumulative count of Article Views (full-text article views including HTML views, PDF and ePub downloads, according to the available data) and Abstracts Views on Vision4Press platform.
Data correspond to usage on the plateform after 2015. The current usage metrics is available 48-96 hours after online publication and is updated daily on week days.
Initial download of the metrics may take a while.