Free Access
Fig. 4
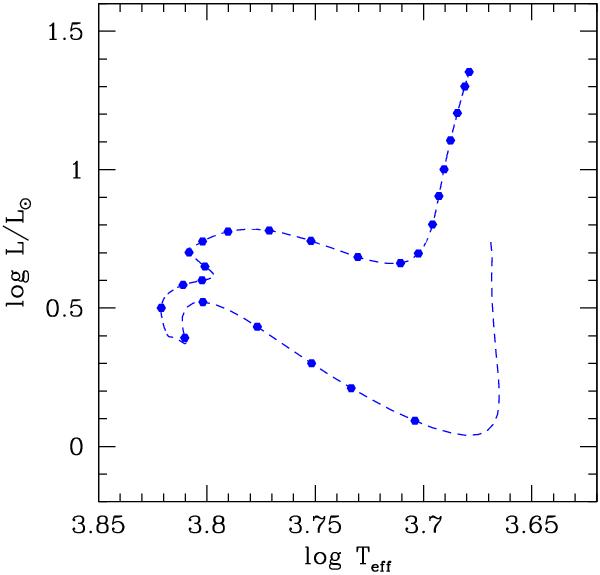
Evolutionary track for a 1.3 M⊙ sequence of models from PMS to RGB. Dots indicate models for which rotational splittings are computed. The numbering of the selected models stars with the first dot on the PMS and ends with number 25 as the highest dot on the RGB.
Current usage metrics show cumulative count of Article Views (full-text article views including HTML views, PDF and ePub downloads, according to the available data) and Abstracts Views on Vision4Press platform.
Data correspond to usage on the plateform after 2015. The current usage metrics is available 48-96 hours after online publication and is updated daily on week days.
Initial download of the metrics may take a while.