Fig. 12
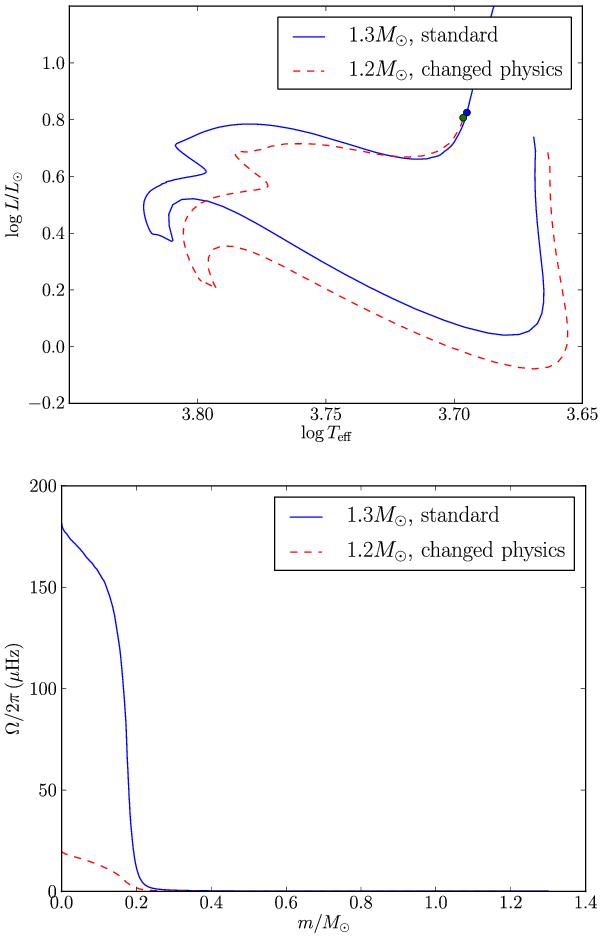
Top: HR diagram showing the evolutionary track of a 1.2 M⊙ model computed with an overshoot of 0.1HP, a vertical turbulent viscosity DV computed with Ric = 1, a Dh increased by a factor 102 (red line, dashed), and a 1.3 M⊙ model computed without overshooting and with the “standard” viscosities (blue line, full). Dots indicate the location of models with Δν = 23.3 μHz. Bottom: rotation profiles for the models above.
Current usage metrics show cumulative count of Article Views (full-text article views including HTML views, PDF and ePub downloads, according to the available data) and Abstracts Views on Vision4Press platform.
Data correspond to usage on the plateform after 2015. The current usage metrics is available 48-96 hours after online publication and is updated daily on week days.
Initial download of the metrics may take a while.