| Issue |
A&A
Volume 549, January 2013
|
|
|---|---|---|
| Article Number | A64 | |
| Number of page(s) | 5 | |
| Section | Stellar structure and evolution | |
| DOI | https://doi.org/10.1051/0004-6361/201220207 | |
| Published online | 19 December 2012 | |
Research Note
On the binarity of the classical Cepheid X Sagittarii from interferometric observations⋆
1 INAF – Osservatorio Astronomico di Roma, via Frascati 33, 00040 Monteporzio Catone (RM), Italy
e-mail: This email address is being protected from spambots. You need JavaScript enabled to view it.
2 INAF – Istituto di Astrofisica e Planetologia Spaziale, via Fosso del Cavaliere 100, 00133 Rome, Italy
3 Università degli Studi di Roma “Tor Vergata”, via della Ricerca Scientifica 1, 00133 Rome, Italy
Received: 10 August 2012
Accepted: 20 November 2012
Abstract
Context. Optical-infrared interferometry can provide direct geometrical measurements of the radii of Cepheids and/or reveal any unknown binary companions of these stars. Such information is very important for properly calibrating the period-luminosity relations and determining binary fraction among Cepheids.
Aims. We observed the Cepheid X Sgr with VLTI/AMBER in order to confirm or disprove the presence of the hypothesized binary companion and to directly measure the mean stellar radius, possibly detecting its variation along the pulsation cycle.
Methods. From AMBER observations in MR mode, we performed a binary model fitting on the closure phase and a limb-darkened model fitting on the visibility.
Results. Our analysis indicates that there is a point-like companion at a separation of 10.7 mas, which is 5.6 magK fainter than the primary and whose flux and position are sharply constrained by the data. The radius pulsation is not detected, whereas the average limb-darkened diameter results in 1.48 ± 0.08 mas, corresponding to 53 ± 3 R⊙ at a distance of 333.3 pc.
Key words: stars: variables: Cepheids / binaries: close / techniques: interferometric / instrumentation: interferometers / infrared: stars
Based on observations collected at the European Southern Observatory, Paranal, Chile.
© ESO, 2012
1. Introduction
Classical Cepheids are fundamental astrophysical objects, which are the most popular primary distance indicators in the nearby Universe. These pulsating stars obey well defined period-luminosity (PL) relations, so that it is possible to derive their distance moduli by measuring periods and apparent magnitudes.
Cepheids can be used to trace the evolutionary properties of helium-burning intermediate-mass stars, because they cross the instability strip along the so-called “blue loops” in the HR diagram. However, the comparison between pulsation and evolutionary masses disclosed the problem known as “Cepheid mass discrepancy” (Cox 1980), caused by the pulsation masses that are systematically lower than the evolutionary ones (see e.g. Bono et al. 2001; Beaulieu et al. 2001; Caputo et al. 2005; Keller & Wood 2006).
Recently, two double eclipse binary Cepheids have been identified in the Large Magellanic Cloud (Pietrzyński et al. 2011; Pietrzyński et al. 2011), providing the first measurements of the dynamical mass of classical Cepheids with 1 − 3% accuracy, whose values support the pulsation masses or the mass-luminosity relations based on evolutionary models that account for mild convective core overshooting (Cassisi & Salaris 2011; Prada Moroni et al. 2012). For noneclipsing binaries, direct orbital determination of the companion by means of optical interferometry would provide dynamical mass estimates able to disentangle the mass discrepancy problem.
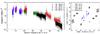 |
Fig. 1 Left: calibrated V2 versus spatial frequency B/λ for the entire set of observations, superimposed on the average UD model (continuous line). Right: spatial frequencies (u,v-plane) coverage. Different colors and symbols refer to different observing nights (see legends). The 2011 Jun. 25 night is not plotted in the left panel due to a very unstable TF for V2. |
Log of the interferometric observations, with details on the SCIence-CALibrators sequence used and the optimal frame selection adopted for V2 and φ, magnitude and diameters of the two calibrators.
The binary fraction of the Cepheids has an impact on the Cepheid distance scale in the optical bands, since the companions are typically main sequence (MS) stars. The binarity analysis has been applied to a limited sample (Szabados 2003), but current estimates indicate that the binary fraction among MS B-type stars ranges from 60% to 70% (Brott et al. 2011; Chini et al. 2012).
To improve the current observational scenario we have observed the Cepheid X Sgr with the VLTI. This particular target was selected because i) its trigonometric parallax has been recently measured by Benedict et al. (2007); ii) accurate radial velocity curves are available (Mathias et al. 2006; Storm et al. 2011); and iii) it was suggested by Szabados (1990), on the basis of temporal changes in the γ-velocity, that X Sgr might be a binary, although this finding has always been controversial (Mathias et al. 2006; Groenewegen 2008).
2. Observations and data reduction
2.1. Data acquisition
We observed X Sgr (HD 161592, RA 17:47:33.62, Dec − 27:49:50.83, J2000) using VLTI/AMBER (Petrov et al. 2007) with the auxiliary telescopes. We used medium spectral resolution in the K-band (MR, R ~ 1500, 2.1 μm) and the fringe tracker FINITO (Gai et al. 2004) with a frame exposure time of 1 s. Observations were carried out with a maximum projected baseline length of 127.8 m, corresponding to a 3.1 mas spatial resolution, with the atmospheric seeing in the 0.7′′ ÷ 1.0′′ range.
For the sake of clarity, we distinguish here a Run A (six nights from 2011 Apr. 24 to 2011 Jun. 25) and a Run B (2012 Mar. 31 night only, see Table 1 and Fig. 1). For each run we used a CAL-SCI-CAL observation scheme (Table 1) to better sample the variable instrument response during the night.
2.2. Data reduction
We used the amdlib v31 (Tatulli et al. 2007; Chelli et al. 2009) reduction package in conjunction with custom IDL scripts for optimizing the fringe selection, computing averages, and calibrating the visibilities. Each AMBER file contains many individual frames, which must be quality-selected to reject tracking losses in both FINITO and telescope guiding. Such events are associated to high values in the optical path difference (OPD), and they cause a poor signal-to-noise ratio (S/N) of the fringes. We adopted the amdlib “PISTON+S/N” selection criteria, limiting the OPD variation below 8 μm and keeping only the frames with the highest fringe S/N. The adopted percentage of frames, in the range 10 ÷ 50% for visibility V2 and 100% for closure phase φ, has been optimized for each night separately (see Table 1). We therefore computed, for each file, the average values of V2 and φ, weighted by the error estimate provided by amdlib and the same was done for the calibrators. Finally, a night transfer function (TF) was computed using the calibrators listed in Table 1.
3. Results and discussion
3.1. Visibilities and closure phases
Figure 1 shows the calibrated V2 as a function of the spatial frequency B/λ, while Fig. 2 displays the calibrated φ versus wavelength λ. We see that the source is resolved, because V2 is less than unity, and that significant deviations from a pure uniform disk (UD) are evident. This could indicate a possible detection of the Cepheid pulsation, or might suggest a more complex morphology like that of a binary. In either case, we only see small deviations from zero in the φ plot, which is an indication that the companion, if present, should be faint and close to our detection limit.
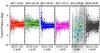 |
Fig. 2 Calibrated φ versus λ for the entire set of observations. Colors and symbols are the same as in Fig. 1. The yellow line shows the binary model described in Sect. 3.2 providing the best fit to the Run A observations. The dates reported above the panels refer to the observing nights. |
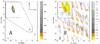 |
Fig. 3 Portion of the reduced χ2 map on the RA and Dec offsets obtained by A) fitting the φ of the Run A data sets with a point-like companion model at fixed flux ratio f = 6 × 10⁻³, and B) for individual observing nights: red for 2011 Apr. 24, green for 2011 May 03/07, and blue for 2011 Jun. 11/25. The 1 ÷ 3σ confidence-contour colors range from yellow to orange. |
Both plots, in particular the V2, show that the error bars are clearly larger than the dispersion of the data points, indicating a correlated noise caused by the low-frequency variations (on time scales of minutes) of the TF during the night.
3.2. Model fitting
3.2.1. Binary companion
On the basis of changes in the γ-velocity, Szabados (1990) suggested that X Sgr might be a binary system with a period of ~507 days. The complex nature of X Sgr was further supported by Sasselov & Lester (1990), who spectrally found that line asymmetries and line-doubling were well beyond the typical Cepheid behavior; in particular, the two absorption components showed different Doppler shifts, but they did not display any secular velocity changes compared with the γ-velocity. This complex dynamical structure was also supported by other high-resolution (R ~ 120 000) optical spectra by Mathias et al. (2006). They hypothesized a binary, or even triple, nature for X Sgr. The data available in the literature have been analyzed by Feast et al. (2008) and by Groenewegen (2008), who also found evidence of binarity, suggesting a slightly longer orbital period (~570 days).
To check the companion hypothesis, we performed a binary model fit to the closure phase φ. We decided to use only this observable, for its low sensitivity on the unknown radius variation, for which we adopted a crude UD estimate of rUD = 0.74 mas, provided by the V2 values at the largest baselines, namely the data from nights 2011 Apr. 24, 2011 May 03, and 2012 Mar. 31.
We started with Run A alone, assuming no temporal variation in the binary configuration within the two months, which is a plausible assumption, considering the above orbital period estimates. Therefore we fit the Run A data all together in order to increase accuracy. Run B was not included here, since it was acquired ten months later. We adopted a grid search on a wide parameter space in Δx,Δy,f, and r2, where Δx and Δy are the RA and Dec offsets of the companion (searched within a radius of 100 mas around the primary, see Absil et al. 2011), f is the flux ratio of the companion to the primary, and r2 the companion UD radius.
We obtain the best fit result for a flux ratio of f = (6 ± 1) × 10-3 (corresponding to a 5.6 ± 0.2 magnitude difference), while r2 tends to zero, thus confirming the presence of a faint and unresolved companion, whose position is constrained by a single and well defined χ2 minimum at 7.15 ± 0.04 S, 8.00 ± 0.02 E mas from the primary (see Fig. 3, panel A): Table 2 summarizes all the companion parameters. The best fit reduced χ2 significantly smaller than one is due to the large error bars associated to the TF, already described in Sect. 3.1.
To double-check our finding, we built a series of synthetic binary models with different flux ratios and the same error bars of the real data, from which we derived a sensitivity limit of flim = 2 × 10⁻³, that is three times lower than the measured flux ratio.
Finally, to check if we could detect possible companion displacements on different nights, we removed our assumption of fixed binary configuration and repeated the φ fitting separately for each night of Run A (nights 2011 May 03/07 and 2011 Jun. 11/25 were fitted as single points).
The corresponding χ2 maps (Fig. 3, panel B) show several local minima within the 99% confidence interval, all of them having the same probability of being the true position of the companion. This shows us that a single baseline configuration is not sufficient to unambiguously locate such a faint object. However, all these χ2 maps show one local minimum at the companion position, and even more important the little displacements of these minima line up in the correct temporal sequence, as disclosed by Fig. 3, panel B. This empirical evidence further confirms our detection of the postulated companion of X Sgr, and although current data do not allow us to constrain the orbit, we have a hint at the direction of its motion.
The binary fit for the single night of Run B also shows the same kind of multiple minima χ2 map (not displayed), but with no minima are present in the close vicinity of the quoted position, as expected after a time interval of ten months.
Parameters of X Sgr companion, and LD diameters.
3.3. Angular diameter
To determine the mean Cepheid diameter, and possibly its variation, we fit the V2 separately for each night by fixing the binary parameters (Table 2) and only varying the primary radius r1. Following Kervella et al. (2004), we adopted the limb darkening (LD) intensity profile by Claret (2000). The radius r1 only depends on the mean value of each visibility spectrum (⟨ V2(λ) ⟩), whose error bar we computed as the quadratic sum of the weighted average error plus the correlated component due to the TF variation2. For the diameter determination we only took the nights 2011 Apr. 24, 2011 May 03 and 2012 Mar. 31 into account, because they only have sufficiently long baselines and good quality. The night of 2011 May 03 plays a key role in this context, since it shows a pure random error with a negligible correlated component.
Table 2 provides, in the bottom section, the best fit LD diameters as a function of the Cepheid pulsation phase, computed following Szabados (1989). In the table we distinguish the random errors and the systematics coming from the uncertainties in the calibrator diameters (Table 1). The latter are larger than the former only for our best data set, namely the night 2011 May 03, showing the importance of using many different calibrators when a very accurate diameter measurement is required.
Recent X Sgr radius estimates.
The differences in the three diameter estimates, within ~1σ of each other, do not allow us to positively detect the radius pulsation, and they are probably due to the mentioned TF temporal variation. The same limitation was also found by Kervella et al. (2004) using interferometric data collected with VINCI at VLTI.
We therefore only computed a mean physical radius of 53 ± 3 R⊙ by adopting the trigonometric parallax of 3.0 ± 0.18 mas from the HST (Benedict et al. 2007). In Table 3 we compared it with recent estimates from both optical interferometry (Kervella et al. 2004) and InfraRed Surface Brightness (IRSB, Groenewegen, priv. comm.; and Storm et al. 2011), having used the same distance for all of these measurements. Finally, we also report the radius obtained by neglecting the binary companion, which has a ~3% impact on the mean radius.
4. Conclusions
We found evidence of the binary nature of the Cepheid X Sgr by analyzing new interferometric data collected with AMBER at VLTI. The main conclusions of our work can be summarized as follows
-
i)
Our analysis of the closure phase indicates that both the flux and the position of the companion can be constrained by our data sets. We find that the angular separation is 10.7 mas and that the companion is 5.6 mag fainter than the primary in the K-band.
-
ii)
The data allow us to directly measure an average LD diameter of 1.48 ± 0.08 mas (i.e. a physical radius of 53 ± 3 R⊙) which agrees, at 1σ level, with similar interferometric and IRSB mean radii for X Sgr available in the literature.
-
iii)
We find that MR AMBER closure phases obtained from three baseline configurations have the sensitivity needed to detect companions around nearby classical Cepheids. This evidence becomes even more compelling if we consider that current data were collected in medium-quality seeing conditions.
-
iv)
The average visibilities of the 2001 May 03 night show that an unsystematic error as small as 1% can be obtained with AMBER in MR mode in stable TF conditions. This would be sufficient to clearly trace the differential diameter pulsation in future measurements, provided that the same calibrator star is used for all the observations.
-
v)
We find that, in the case of a binary Cepheid, the effect introduced by the companion on the primary radius measurement (~3%) is comparable to the expected radius variation (~5 ÷ 10%).
Available at http://www.jmmc.fr/amberdrs
Where the correlated component was estimated, for each visibility spectrum, as the squared difference between the rms of the error bars and the r.m.s. of the residuals with respect to a smooth polynomial fitting.
Acknowledgments
This paper benefited from funding from the Fizeau laboratory of Nice Observatory in France, to which we are grateful. We also thanks F. Millour, N. Nardetto, and P. Cruzalebes, for many helpful discussions, M. A. T. Gronewegen and J. Storm for useful insights concerning Cepheids and for providing us with their recent radius measurements of X Sgr, and finally C. Paladini for having acquired the data of Run B.
References
- Absil, O., Le Bouquin, J.-B., Berger, J.-P., et al. 2011, A&A, 535, A68 [Google Scholar]
- Beaulieu, J. P., Buchler, J. R., & Kolláth, Z. 2001, A&A, 373, 164 [NASA ADS] [CrossRef] [EDP Sciences] [Google Scholar]
- Benedict, G. F., McArthur, B. E., Feast, M. W., et al. 2007, AJ, 133, 1810 [NASA ADS] [CrossRef] [Google Scholar]
- Bono, G., Gieren, W. P., Marconi, M., Fouqué, P., & Caputo, F. 2001, ApJ, 563, 319 [NASA ADS] [CrossRef] [Google Scholar]
- Brott, I., Evans, C. J., Hunter, I., et al. 2011, A&A, 530, A116 [NASA ADS] [CrossRef] [EDP Sciences] [Google Scholar]
- Caputo, F., Bono, G., Fiorentino, G., Marconi, M., & Musella, I. 2005, ApJ, 629, 1021 [NASA ADS] [CrossRef] [Google Scholar]
- Cassisi, S., & Salaris, M. 2011, ApJ, 728, L43 [NASA ADS] [CrossRef] [Google Scholar]
- Chelli, A., Utrera, O. H., & Duvert, G. 2009, A&A, 502, 705 [NASA ADS] [CrossRef] [EDP Sciences] [Google Scholar]
- Chini, R., Hoffmeister, V. H., Nasseri, A., Stahl, O., & Zinnecker, H. 2012, MNRAS, 424, 1925 [NASA ADS] [CrossRef] [Google Scholar]
- Claret, A. 2000, A&A, 363, 1081 [NASA ADS] [Google Scholar]
- Cox, A. N. 1980, ARA&A, 18, 15 [NASA ADS] [CrossRef] [Google Scholar]
- Feast, M. W., Laney, C. D., Kinman, T. D., van Leeuwen, F., & Whitelock, P. A. 2008, MNRAS, 386, 2115 [NASA ADS] [CrossRef] [Google Scholar]
- Gai, M., Menardi, S., Cesare, S., et al. 2004, in New Frontiers in Stellar Interferometry (Bellingham, WA: The International Society for Optical Engineering), ed. W. A. Traub, Proc. SPIE, 5491, 528 [Google Scholar]
- Groenewegen, M. A. T. 2008, A&A, 488, 25 [NASA ADS] [CrossRef] [EDP Sciences] [Google Scholar]
- Keller, S. C., & Wood, P. R. 2006, ApJ, 642, 834 [NASA ADS] [CrossRef] [Google Scholar]
- Kervella, P., Nardetto, N., Bersier, D., Mourard, D., & Coudé du Foresto, V. 2004, A&A, 416, 941 [NASA ADS] [CrossRef] [EDP Sciences] [Google Scholar]
- Lafrasse, S., Mella, G., Bonneau, D., et al. 2010, VizieR Online Data Catalog: II/300 [Google Scholar]
- Mathias, P., Gillet, D., Fokin, A. B., et al. 2006, A&A, 457, 575 [NASA ADS] [CrossRef] [EDP Sciences] [Google Scholar]
- Petrov, R. G., Malbet, F., Weigelt, G., et al. 2007, A&A, 464, 1 [NASA ADS] [CrossRef] [EDP Sciences] [Google Scholar]
- Pietrzyński, G., Thompson, I. B., Graczyk, D., et al. 2011, ApJ, 742, L20 [Google Scholar]
- Prada Moroni, P. G., Gennaro, M., Bono, G., et al. 2012, ApJ, 749, 108 [NASA ADS] [CrossRef] [Google Scholar]
- Sasselov, D. D., & Lester, J. B. 1990, ApJ, 362, 333 [NASA ADS] [CrossRef] [Google Scholar]
- Storm, J., Gieren, W., Fouqué, P., et al. 2011, A&A, 534, A95 [NASA ADS] [CrossRef] [EDP Sciences] [Google Scholar]
- Szabados, L. 1989, Commmunications of the Konkoly Observatory Hungary, 94, 1 [Google Scholar]
- Szabados, L. 1990, MNRAS, 242, 285 [NASA ADS] [CrossRef] [Google Scholar]
- Szabados, L. 2003, Inform. Bull. Variable Stars, 5394, 1 [Google Scholar]
- Tatulli, E., Millour, F., Chelli, A., et al. 2007, A&A, 464, 29 [NASA ADS] [CrossRef] [EDP Sciences] [Google Scholar]
All Tables
Log of the interferometric observations, with details on the SCIence-CALibrators sequence used and the optimal frame selection adopted for V2 and φ, magnitude and diameters of the two calibrators.
All Figures
|
Fig. 1 Left: calibrated V2 versus spatial frequency B/λ for the entire set of observations, superimposed on the average UD model (continuous line). Right: spatial frequencies (u,v-plane) coverage. Different colors and symbols refer to different observing nights (see legends). The 2011 Jun. 25 night is not plotted in the left panel due to a very unstable TF for V2. |
| In the text | |
|
Fig. 2 Calibrated φ versus λ for the entire set of observations. Colors and symbols are the same as in Fig. 1. The yellow line shows the binary model described in Sect. 3.2 providing the best fit to the Run A observations. The dates reported above the panels refer to the observing nights. |
| In the text | |
|
Fig. 3 Portion of the reduced χ2 map on the RA and Dec offsets obtained by A) fitting the φ of the Run A data sets with a point-like companion model at fixed flux ratio f = 6 × 10⁻³, and B) for individual observing nights: red for 2011 Apr. 24, green for 2011 May 03/07, and blue for 2011 Jun. 11/25. The 1 ÷ 3σ confidence-contour colors range from yellow to orange. |
| In the text | |
Current usage metrics show cumulative count of Article Views (full-text article views including HTML views, PDF and ePub downloads, according to the available data) and Abstracts Views on Vision4Press platform.
Data correspond to usage on the plateform after 2015. The current usage metrics is available 48-96 hours after online publication and is updated daily on week days.
Initial download of the metrics may take a while.