Fig. 1
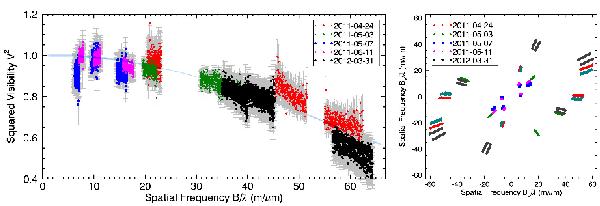
Left: calibrated V2 versus spatial frequency B/λ for the entire set of observations, superimposed on the average UD model (continuous line). Right: spatial frequencies (u,v-plane) coverage. Different colors and symbols refer to different observing nights (see legends). The 2011 Jun. 25 night is not plotted in the left panel due to a very unstable TF for V2.
Current usage metrics show cumulative count of Article Views (full-text article views including HTML views, PDF and ePub downloads, according to the available data) and Abstracts Views on Vision4Press platform.
Data correspond to usage on the plateform after 2015. The current usage metrics is available 48-96 hours after online publication and is updated daily on week days.
Initial download of the metrics may take a while.