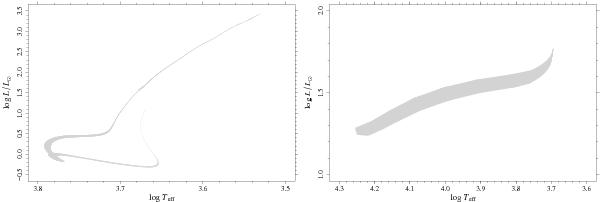
Fig. 2

Left panel: Hertzsprung-Russell (HR) diagram showing the error stripe due to the variation of all the seven analyzed physical inputs (i.e. p1,...,p7 in Table 1) on the stellar track with M = 0.9 M⊙, Z = 0.006, Y = 0.26 from pre-main sequence to helium flash. The narrowing of the error stripe in the RGB is due to the fact that the perturbed stellar models are disposed along the tracks itself. See text for details. Right panel: as in the left panel, but for the ZAHB.
Current usage metrics show cumulative count of Article Views (full-text article views including HTML views, PDF and ePub downloads, according to the available data) and Abstracts Views on Vision4Press platform.
Data correspond to usage on the plateform after 2015. The current usage metrics is available 48-96 hours after online publication and is updated daily on week days.
Initial download of the metrics may take a while.


