| Issue |
A&A
Volume 549, January 2013
|
|
|---|---|---|
| Article Number | A41 | |
| Number of page(s) | 15 | |
| Section | Galactic structure, stellar clusters and populations | |
| DOI | https://doi.org/10.1051/0004-6361/201219976 | |
| Published online | 13 December 2012 | |
The Na-O anticorrelation in horizontal branch stars
III. 47 Tucanae and M 5 ⋆,⋆⋆
1 INAF – Osservatorio Astronomico di Padova, Vicolo dell’Osservatorio 5, 35122 Padova, Italy
e-mail: raffaele.gratton@oapd.inaf.it
2 INAF – Osservatorio Astronomico di Bologna, via Ranzani 1, 40127 Bologna, Italy
3 European Southern Observatory, Alonso de Cordova 3107, Vitacura, Santiago, Chile
4 Department of Physics & Astronomy, Macquarie University, Balaclava Rd., North Ryde, Sydney, NSW 2109, Australia
5 Monash Centre for Astrophysics, School of Mathematical Sciences, Building 28, Monash University, VIC 3800, Australia
6 INAF – Osservatorio Astronomico di Teramo, Via Collurania, Teramo, Italy
7 Astrophysics Research Institute, Liverpool John Moores University, Twelve Quays House, Birkenhead, UK
Received: 9 July 2012
Accepted: 4 October 2012
To check the impact of the multiple population scenario for globular clusters on their horizontal branch (HB), we present an analysis of the composition of 110 red HB (RHB) stars in 47 Tucanae and of 61 blue HB (BHB) and 30 RHB stars in M 5. In 47 Tuc we found tight relations between the colours of the stars and their abundances of p-capture elements. This strongly supports the idea that the He content – which is expected to be closely correlated with the abundances of p-capture elements – is the third parameter (after overall metallicity and age) that determines the colour of HB stars. However, the range in He abundance must be small (ΔY < 0.03) in 47 Tuc to reproduce our observations; this agrees with previous analyses. There is possibly a correlation between the abundances of p- and n-capture elements in 47 Tuc. If confirmed, this might suggest that asymptotic giant branch stars of moderate mass contributed to the gas from which second-generation stars formed. Considering the selection effects in our sample (which does not include stars warmer than 11 000 K and RR Lyrae variables, which were excluded because we could not obtain accurate abundances with the adopted observing procedure) is important to understand our results for M 5. In this case, we find that, as expected, RHB stars are Na-poor and O-rich, and likely belong to the primordial population. There is a clear correlation of the [Na/O] ratio and N abundance with colour along the BHB. A derivation of the He abundance for these stars yields a low value of Y = 0.22 ± 0.03. This is expected because HB stars of a putative He-rich population in this cluster should be warmer than 11 000 K, and would accordingly not have been sampled by our analysis. However, we need some additional source of scatter in the total mass loss of stars climbing up the red giant branch to reproduce our results for M 5. Finally, we found a C-star on the HB of 47 Tuc and a Ba-rich, fast-rotating, likely binary star on the HB of M 5. These stars are among the brightest and coolest HB stars.
Key words: stars: abundances / stars: evolution / stars: Population II / globular clusters: individual: 47 Tucanae / globular clusters: individual: M5
Full Tables 2–6 are only available in electronic form at the CDS via anonymous ftp to cdsarc.u-strasbg.fr (130.79.128.5) or via http://cdsarc.u-strasbg.fr/viz-bin/qcat?J/A+A/549/A41
© ESO, 2012
1. Introduction
Core He-burning stars in globular clusters (GC) are distributed along the so-called horizontal branch (HB) in the colour-magnitude diagram (CMD). It is well known that this distribution may be very different from cluster to cluster. The precise location of an individual star along the HB changes due to evolution; however, most of the lifetime on the HB is spent close to the zero age horizontal branch (ZAHB) location. Hence, the colour distribution of stars along the HB largely, though not uniquely, reflects their ZAHB distribution. In turn, several parameters may affect this distribution: total mass (itself related to various parameters, such as age, metallicity, and He content), core mass, overall metallicity, CNO/Fe ratio, etc. (see e.g. Catelan & De Freitas Pacheco 1995). Some of these quantities might be related to very poorly known parameters, such as core rotation or details of the mass loss. In principle, this allows to use HB stars as a very sensitive diagnostic for quantities otherwise difficult to determine. Separating these effects is difficult: progress has been quite slow and many facts still need an adequate explanation.
It has been clear for nearly half a century that the main parameter is related to the overall metal content (Sandage & Wallerstein 1960; Faulkner 1966). For a long time, age has been considered the most likely candidate for the second parameter (see Lee et al. 1994). The small age difference between GCs implied that confirming this assumption is difficult and it was then achieved only recently (Dotter et al. 2010; Gratton et al. 2010). Even more recently, it has become clear that star-to-star He abundance variations within a cluster, related to the presence of multiple populations in most if not all GCs, are the most likely third parameter. This is because He-rich stars (known to be present in GCs: e.g. Piotto et al. 2005) evolve faster on the main sequence and then their progeny on the HB is less massive than that of He-poor stars (Norris et al. 1981; D’Antona et al. 2002; D’Antona & Caloi 2004). There are many circumstantial facts supporting this assertion (Carretta et al. 2009a; Gratton et al. 2010). Direct confirmation may come from spectroscopic analysis of the chemical composition of stars along the HB. The surface He abundance of evolved stars is indeed slightly higher than the original value due to the first dredge up (see e.g. Sweigart 1987); however, this difference is small (~0.015 in Y). Unfortunately, determining the initial He content of HB stars is possible only for a limited range of temperatures, because the surface composition of stars with Teff > 11 000 K is strongly modified by sedimentation effects (see e.g. Behr et al. 1999) and He lines are vanishingly weak in cool stars. Furthermore, determinations need to be accurate to be really meaningful. While some determinations of He abundances of adequate precision and accuracy have been made for stars with 9000 < Teff < 11 000 K (Villanova et al. 2009, 2012), this temperature limitation is severe. It is much easier to determine the abundances of other elements (including e.g. Na and O) that are thought to be correlated with He in the multiple population scenario (see reviews by Gratton et al. 2004, 2012a). They can be determined for all stars cooler than Teff < 11 000 K; this makes the test useful for a quite large number of GCs. Marino et al. (2011) presented such a determination for M 4, showing that Na-poor/O-rich stars lie on the RHB and Na-rich/O-poor are on the BHB of this GC, as expected if the colour distribution of stars along the HB is mainly determined by He-abundance variations. To extend this result to a wider sample of GCs, we began a systematic survey of the abundances of O and Na (and other relevant elements) in HB stars of a few GCs. Clusters were selected to have a large number of stars cooler than 11 000 K, but with a wide range of properties. We previously presented data for NGC 2808 (Gratton et al. 2011, Paper I) and NGC 1851 (Gratton et al. 2012b, Paper II). In this paper we present the analysis of 47 Tuc (=NGC 104) and M 5 (=NGC 5904). Results for a few other GCs (NGC 6388, NGC 6656=M 22, NGC 6723) will be presented in future papers.
Both 47 Tuc and M 5 are well-studied GCs. The Na-O anticorrelation for a large number of red giant branch (RGB) stars of these clusters is presented in Carretta et al. (2009a,b). Both clusters have an Na-O anticorrelation, which for 47 Tuc is short for such a massive GC, while M 5 is a more typical massive GC with some very O-poor stars. 47 Tuc is the classical example of metal-rich GCs with red HB. A few authors (see Mohler et al. 2000 and references therein) found a few blue HB stars in 47 Tuc. Their origin is not known, but they likely are not connected to an extremely rich He population but rather have a different origin, e.g. they may be stars that have lost an abnormal amount of mass in mass transfer episodes in binary systems. We have not observed any of these stars in our programme, and we will not discuss them any further. Among the many photometric analyses of the HB, the most interesting to us are the very recent works by Di Criscienzo et al. (2010) and Nataf et al. (2011), who found evidence for a spread in He by 2 per cent in mass, and by Milone et al. (2012), who confirmed this result and showed that the different populations present in this cluster can be traced from the main sequence up to the HB. Low-resolution spectra of HB stars have been analysed by Norris & Freeman (1982), who found evidence for a C-N anticorrelation. While the number of stars observed was quite small and only qualitative information on composition were obtained, it has been recently recognized that CN-poor HB stars in this sample are redder and fainter than CN-rich ones (Milone et al. 2012), as expected if He determines the colour of HB stars. A very similar result was obtained by Briley (1997): see in particular his impressive Fig. 8. In addition, Nataf et al. (2011) noticed that there is a gradient in the colour of HB stars within the cluster, bluer stars being more centrally concentrated than redder ones. These authors interpreted this finding in the framework of a multiple populations scenario as evidence that second-generation stars are more centrally concentrated than first-generation ones. Again, a similar result was previously obtained by Briley (1997). These studies essentially confirm that the HB of 47 Tuc contains different populations; however, a high-dispersion spectroscopic study of a much larger sample of stars is required to confirm the suggested correlation between the location of stars on the HB and their composition.
The extended HB of M 5 has been studied photometrically. After the pioneering study by Greenstein & Munch (1966), who noticed the weakness of He lines in warm blue HB stars in this and other globular clusters, Peterson (1983) determined radial and rotational velocities for seven blue HB (BHB) stars; Crocker et al. (1988) determined surface gravities for 12 BHB stars in agreement with the values expected from HB models; and Lai et al. (2011) examined two red HB (RHB) stars finding that they are O-rich and moderately Na-poor. The observational material on which these papers are based is not sufficient to discuss the relation between HB and the Na-O anticorrelation.
The outline of this paper is as follows: in Sect. 2 we present observational data. Details on the analysis – which is very similar to those already presented in Papers I and II – are given in Sect. 3. Results are presented and discussed in Sect. 4, while conclusions are drawn in Sect. 5.
Observing log.
Basic data for programme stars in 47 Tuc (complete table available only electronically at CDS).
Basic data for programme stars in M 5 (complete table available only electronically at CDS).
2. Observations
We acquired spectra of 110 RHB stars in 47 Tuc (nine of them much brighter than the remaining ones; they are either objects in very late phases of HB evolution or massive objects resulting from evolution in mass transfer binaries), and of 61 BHB and 30 RHB stars (including 12 bright and likely evolved stars) in M 5 using the GIRAFFE fibre-fed spectrograph at the VLT (Pasquini et al. 2004). Three additional RHB candidates in M5 turned out to be field interlopers with a clearly deviating radial velocity and much higher metallicity than cluster members. The spectral resolution is R = 18 700 for grating R12 (wavelength range 5821–6146 Å) and R = 13 900 for grating HR19A (wavelength range 7745–8335 Å). Our program was executed in service mode. Single observations were obtained with the individual gratings. The log of observations is given in Table 1. Figures 1 and 3 show the location of the programme stars on the colour magnitude diagrams of 47 Tuc and M 5, respectively. Our ground-based photometric catalogue (see Momany et al. 2004) consists of UBVI observations obtained with the Wide-Field Imager (WFI) mounted on the 2.2 m ESO-MPI telescope (La Silla, Chile). The WFI catalogue has a total field of view of 34′ × 33′. Photometric data for the programme stars are listed in Table 2. Note that at variance with the other colours, the U photometry is not calibrated. The K magnitudes are from the 2MASS point source catalogue (Skrutskie et al. 2006).
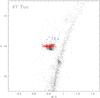 |
Fig. 1 Colour–magnitude diagram of 47 Tuc. Circles are the stars analysed in this paper: red symbols are our faint stars group, while the blue ones are the bright stars group. Dots are stars not observed in this paper. |
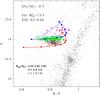 |
Fig. 2 Colour–magnitude diagram of 47 Tuc. Triangles are the stars analysed in this paper: green symbols are our faint stars group, while the magenta ones are the bright stars group. Dots are stars not observed in this paper. For comparison, location of ZAHB stars of different masses and He abundances (Y = 0.25: red dots and solid line; Y = 0.28: blue dots and solid line), the evolutionary tracks off the ZAHB for stars of 0.65 M⊙ (dashed lines) are also plotted. |
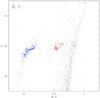 |
Fig. 3 Colour–magnitude diagram of M 5. Red circles are RHB stars, blue circles are BHB stars. Dots are stars not observed in this paper. |
Stars in 47 Tuc are spread over the whole range in colour of the RHB (0.708 < (B − V) < 0.891) but in two restricted ranges in magnitude: nine bright objects (13.7 < V < 13.8) and a much larger group of fainter ones (13.94 < V < 14.03). This selection in magnitude is not representative of the distribution in magnitude of the whole sample of RHB stars. The brighter group of objects includes either objects in the later phases of HB evolution or more massive objects resulting from the evolution of binary systems (see Sect. 4.8). Figure 2 compares the location of the programme stars with ZAHB models for different masses and He abundances, as well with evolutionary tracks off the ZAHB for stars of 0.65 M⊙. The group of bright stars is represented by magenta triangles. As can be seen, they may either be ZAHB stars with masses in the range 1.1–1.6 M⊙, or stars of ~0.65 M⊙ in later evolutionary phase. In the first case, they may result from the evolution of blue straggler stars. As to the fainter group, since the ZAHB of 47 Tuc is slightly tilted towards the red (Di Criscienzo et al. 2010; Nataf et al. 2011), our sample includes blue objects close to the ZAHB as well as slightly evolved objects in the redder region. Since evolution off the ZAHB becomes faster with increasing luminosity, reconstruction of the true distribution of stars with different chemical composition requires a comparison with synthetic HBs. However, He-rich (and the Na-rich and O-poor) stars are likely over-represented in our sample. All BHB stars we observed in M 5 are cooler than the Grundahl et al. (1999) u-jump, and could be used in our analysis.
All programme stars were chosen to be free from any companion closer than 2 arcsec and brighter than V + 2 mag, where V is the target magnitude. The remaining fibres were used to acquire sky spectra. The median spectra from these last fibres were subtracted from those used for the stars.
We used two spectral configurations: HR12 and HR19, providing high-resolution spectra including the strongest features of OI (the IR triplet at 7771–74 Å) and NaI (the resonance D doublet at 5890–96 Å, as well as the subordinate strong doublet at 8183–94 Å) accessible from ground and the only ones that might be used to determine O and Na abundances without a prohibitively long observing time. A few lines of N, Mg, Al, Si, Ca, Fe, and Ba, as well as a number of CN lines, are also included in the selected observing ranges.
The signal-to-noise ratio (S/N) of the spectra is typically ~50–60 and ~80 for 47 Tuc stars, and ~40–50 and ~50–70, for those in M 5 (for each cluster, the first number is for HR12 and the second one is for HR19). The spectra were reduced by the ESO personnel using the ESO FLAMES GIRAFFE pipeline version 2.8.7. Sky subtraction, translation to rest-frame and continuum tracing were performed within IRAF1. Telluric absorption lines were removed from the longest wavelength spectra by dividing them for the average spectrum of the warmer HB stars (those with Teff > 11 500 K) in NGC 1851, which are essentially featureless in the spectral region of interest. A few very high excitation lines are present in this spectral region, e.g. the OI and NI lines. However, radial velocity of stars in NGC 1851 is so much different from those of the stars in M5 and 47 Tuc that there is no danger of over-positioning the lines. This step required some adaptation to achieve a similar telluric line strength because the spectra of NGC 1851 HB stars were not acquired with the same airmass as the programme ones. The excision of the telluric lines was efficient, however. Examples of spectra are shown in Fig. 4.
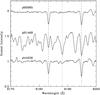 |
Fig. 4 Portion of the spectra of three RHB stars of 47 Tuc (#92985: upper row; #81468: middle row; #44226: lower row). The first two spectra are offset vertically for clarity. These spectra have been shifted at zero radial velocity; telluric features are excised following the technique described in the text. Dashed lines mark the NaI doublet at 8183-94 Å; the dotted line marks the strongest CN line in this spectral region (many other CN lines are present). Note that #81468 is a C-star, discussed in Sect. 4.8. |
Abundances of Fe, O, Na, and Al in HB stars of 47 Tuc (complete table available only electronically at CDS).
2.1. Membership and radial velocities
A comparison with the Galactic model by Robin et al. (2003) indicates that RHB stars of 47 Tuc have a membership probability P > 96% (90% of the stars with P > 99%) and there is a 41% probability that all stars are cluster members, once colours, magnitudes, stellar density, and radial velocities are taken into account.
While such data were not available for the programme stars in 47 Tuc, Cudworth (1979) provided membership probability for bright stars in M5 based on proper motions. There are 42 stars in common with our sample. For 39 stars, the membership probabilities is >95%. The three remaining cases (two BHB stars: #31865 and #32273; and an RHB one: #40293) have a membership probability from proper motions between 1 and 18%. However, they are also likely cluster members. Indeed, the models by Robin et al. (2003) indicate that we do not expect any contamination for the BHB of M 5. Although some contamination is possible for RHB stars, the probability that all RHB stars are cluster members is 80%, and #40293 is not distinguishable from M 5 stars for any other property. On the other hand, three stars with colours and magnitudes similar to those on the RHB of M5 turned out to have discrepant radial velocities and metal abundances, and were not considered to be members. They all lie far from the cluster centre at distances larger than 8 arcmin, to be compared with half-light and tidal radii of 1.77 and 24 arcmin, respectively (Harris 1996; we used the latest available version at URL www.physics.mcmaster.ca/Globular.html). They were omitted from our analysis and tables.
Radial velocities Vr were obtained using the fxcor IRAF routine with suitable templates. They are listed in Tables 2 and 3 for 47 Tuc and M 5, respectively. We obtained Vr = −19.6 ± 0.9 kms-1 (rms of 9.5 kms-1) from 110 stars in 47 Tuc. For comparison, the value listed by Harris (1996) is − 18.0 ± 0.1 kms-1, with a central velocity dispersion of 11.0 kms-1. For M 5, we obtained averages of 53.0 ± 0.4 kms-1 (rms of 3.5 kms-1) from 61 BHB stars and of 51.6 ± 0.9 kms-1 (rms of 5.0 kms-1) from 30 RHB stars. Harris’ value is 53.2 ± 0.4 kms-1, with a central velocity dispersion of 5.5 kms-1. The overall agreement is excellent, although it is possible that radial velocities for RHB stars have a small (~1 kms-1) negative offset that might be due to the template used.
Abundances of Si, Ca, Ti, V, Mn, Ni, and Ba in HB stars of 47 Tuc (complete table available only electronically at CDS).
Elemental abundances in HB stars of M 5 (complete table available only electronically at CDS).
Sensitivity and error analysis.
3. Analysis
The analysis follows procedures similar to those adopted for NGC 2808 (Paper I) and NGC 1851 (Paper II). Only a few modifications were made.
3.1. Atmospheric parameters
For RHB stars, effective temperatures Teff were derived from the B − V and V − K colours, using the calibration of Alonso et al. (1999, with the erratum of Alonso et al. 2001). The colours were dereddened using the E(B − V) values from the updated on-line version of the Harris (1996) catalogue and the E(V − K)/E(B − V) value from Cardelli et al. (1989). The calibrations require input values for the metallicity [A/H]2. We adopted the values obtained by Carretta et al. (2009c). The rms of the differences of the temperatures from B − V and V − K is 56 K for 47 Tuc and 109 K for M 5. The larger scatter found for M 5 is expected since stars are fainter and photometric errors larger.
For the blue HB stars in M 5, we started from the (B − V) − Teff calibration by Kurucz3, as for NGC 2808. Infrared colours from 2MASS are not reliable for these faint stars. To reduce errors, we averaged temperatures from (B − V) colours with those provided from (V − I) and (U − B). Since U magnitudes are not calibrated, we first obtained the best-fit regression line between our U − B colours and Teff from (B − V), and then averaged the values of Teff provided by this relation with the other estimates. We note that the rms scatter around this relation is 213 K. As in Paper II, we assumed errors of 50 and 200 K as representative values for the internal errors in the temperatures for RHB and BHB stars, respectively. Systematic errors due to scale errors or incorrect parameters for the cluster are likely larger. We discuss below their potential impact on our results.
The surface gravities were obtained from the masses, luminosities, and effective temperatures. For the masses, we adopted values of 0.648 M⊙ for the RHB stars of 47 Tuc, and of 0.687 and 0.573 M⊙ for stars on the RHB and BHB in M 5 (see Gratton et al. 2010, for a discussion of values adequate for the different sequences). The BHB mass we consider here was taken from the analysis of Gratton et al. (2010). Masses given there are based on polynomial fits to results from the PISA evolutionary models, and might have small errors of up to 0.03 M⊙ in their values. However, such an error in the mass – which would be important if used to compute stellar models – has a very minor effect here since even a large difference of 0.05 M⊙ will only cause a difference of only 0.04 dex in the surface gravities, with a negligible impact on the abundance analysis. Errors due to other causes (e.g. the assumptions about non-local thermodynamic equilibrium (LTE) effects) are much larger. The bolometric corrections were obtained using calibrations consistent with those used for the effective temperatures (Alonso et al. 1999 for the RHB stars, and Kurucz for the BHB stars). The distance moduli were taken from the Harris (1996) catalogue. Errors in gravities are small. The assumption about masses is likely correct within 10% (0.04 dex error in the gravities), while those on the effective temperature and luminosity cause errors in gravities not larger than ~2% for the RHB stars, and ~8% for the BHB stars. The errors in gravities are then not larger than 0.05 dex for the cool stars and 0.10 dex for the warm ones.
In a preliminary analysis, microturbulence velocities vt for RHB stars were obtained by eliminating any trend of the abundances from FeI line with expected line strength. The rms of individual values obtained by this process were 0.18 kms-1 and 0.32 kms-1 for 47 Tuc and M 5, respectively. However, individual errors are responsible for most of this scatter because only a small number of lines spanning a limited range in line strength could be measured. For this reason we finally adopted the average value of vt = 1.14 kms-1 for 47 Tuc and 1.42 kms-1 for M5 (a similar approach was adopted in Papers I and II). For BHB stars (for which no FeI line was measured) we adopted values of vt as a function of Teff using a relation drawn through data by For & Sneden (2010). While this last choice is formally different from that adopted in Papers I and II (a constant microturbulence velocity of 2 kms-1 for all BHB stars) in practice the same values were obtained for stars with the same temperatures.
3.2. Abundance analysis
The abundance analysis is very similar to that described in Papers I and II and is based on equivalent widths. Results are given in Tables 4 and 5 for 47 Tuc, and in Table 6 for M 5. For Fe lines (only measurable in RHB stars) it is a standard LTE analysis. For Na and O it is a non-LTE analysis: for RHB stars non-LTE corrections were taken from Gratton et al. (1999), while for BHB stars they were provided by Takeda (1997) and Mashonkina et al. (2000). N abundances from NI lines in BHB stars also include non-LTE corrections according to Przybilla & Butler (2001).
The only significant addition in this paper is the analysis of several CN lines that could be measured in the spectra of RHB stars of 47 Tuc. Details are given in Sect. 4.3.
The error analysis is very similar to that given in Paper II. In Table 7 we give the sensitivity of the abundances on the adopted atmospheric parameters as well as estimates of the overall errors. With the exceptions of N, O, Na and perhaps Ba, the scatter in the observed abundances agrees very well with these error estimates.
4. Results and discussion
4.1. Fe abundances
The Fe abundances we obtained from this analysis are [Fe/H] = −0.76 ± 0.01 (rms = 0.06 dex) and −1.27 ± 0.01 (rms = 0.06 dex) for 47 Tuc and M 5, respectively (errors here are simply the standard deviation of the mean values, and do not include systematics). For comparison, the values listed by Carretta et al. (2009c) are [Fe/H] = −0.76 ± 0.02 and −1.33 ± 0.02 for the two clusters.
As a check of the adopted parameters, we notice that a few FeII lines could be measured in RHB spectra. Abundances derived from these lines are in fair agreement with those obtained from the FeI lines: on average we obtained [Fe/H] = −0.87 ± 0.01 and −1.35 ± 0.03 (errors are derived as for Fe I). The slightly lower abundances obtained from FeII lines might be explained by various uncertainties in the analysis (e.g. small systematics in the adopted temperature scale) and by the use of very few FeII lines.
Including Papers I and II, we now have an analysis of large samples of RHB stars in four GCs made with a homogeneous procedure. Table 8 lists the values we obtain, which compare well to those for RGB stars from Carretta et al. (2009c).
Comparison between Fe abundances from RHB and RGB stars.
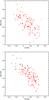 |
Fig. 5 Upper panel: Na-O anticorrelation for HB stars in 47 Tuc; filled squares are the faint stars group, open triangles are the bright stars group. Lower panel: the same for RGB stars (from Carretta et al. (2009a) |
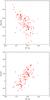 |
Fig. 7 Upper panel: run of the [Na/Fe] ratio with B − V colour along the HB of 47 Tuc; lower panel: the same for the [O/Fe] ratio. Symbols are as in Fig. 5. |
Average abundances.
Table 9 lists the average abundances for 47 Tuc, M 5 (this paper), and NGC 1851 (Paper II). The Al abundance in NGC 1851 RHB stars obtained in Paper II was corrected upward by 0.2 dex because we realized it was obtained by assuming an inconsistent, too high, solar Al abundance. In most cases, we obtained for all these clusters the classical pattern observed in metal-poor stars: overabundances of α-elements (Mg, Si, Ca, Ti) and underabundance of Mn. In the rest of this section we examine evidence for the light elements (He, N, O, Na, Mg, and Al) and for the only n-capture element we observed (Ba).
4.2. Na-O anticorrelation
4.2.1. 47 Tuc
Figure 5 compares the Na-O anticorrelation obtained from RHB stars in 47 Tuc with that obtained for RGB by Carretta et al. (2009a). For this comparison, we checked that our selection of HB stars in 47 Tuc does not miss any significant group of stars. However, the presence of selection effects in magnitude (see Sect. 2) has a significant effect since the fraction of stars for which we acquire spectra is higher among the bluer part of the HB than the red one. As we will see below, there is a correlation between colour of the stars and their [Na/O] ratio. The selection effect considered above accordingly produces a higher percentage of Na-rich and O-poor stars in our sample than are really present along the HB of 47 Tuc. The fraction of stars with [Na/O] > 0.5 in our sample is ~50% too high because of this effect. However, the impact of this effect on the overall distribution of stars along the Na-O anticorrelation is small and the distribution obtained for RHB stars still looks similar to that obtained for RGB stars. The interquartile of the [Na/O] ratio for RHB is 0.48 dex, to be compared with a value of 0.47 dex obtained for RGB stars (see Carretta et al. 2010). We recall that the interquartile is the range in the quantity – in this case the [Na/O] ratio – including 50% of the distribution.
In Fig. 6 we plot the run of the [Na/O] ratio against B − V colour along the HB of 47 Tuc. There is a very good correlation with increasing [Na/O] ratios for decreasing B − V colour (that is, increasing Teff). If we only consider stars of the faint group, the correlation coefficient is r = 0.74 over 99 stars, which is more than a 10 σ effect. This trend is caused by both a decrease in [O/Fe] and an increase in [Na/Fe] with colors becoming bluer (see Fig. 7).
This trend is much stronger than can be explained by observational and systematic errors, and should therefore be true. It implies that the location of a star along the bright part of the HB of 47 Tuc can be predicted with quite a good accuracy if its [Na/O] ratio is known. It recalls the similar results found by Marino et al. (2011) for M 4 and by us (Paper I) for NGC 2808. It can be understood if the variation of the [Na/O] ratio is related to that of He, and the mass of the stars in evolution along the HB is in turn mainly related to their He content. In Sect. 2 we estimated that the masses of HB stars of 47 Tuc range from ~0.60 up to ~0.71 M⊙ (peak to valley); this corresponds to a small range in He abundances of ΔY < 0.03 (Di Criscienzo et al. 2010; Nataf et al. 2011; Milone et al. 2012). The good predictive power of the [Na/O] ratio on the location of a star along the HB of 47 Tuc argues against large random effects (that is, effects that are independent of the Na-O anticorrelation) in the mass loss, at least for this cluster.
We may try to provide an upper limit to such random effects by considering the spread in B − V colours around the best-fitting relation with [Na/O]. This is 0.029 mag. However, part of this spread is caused by observational errors in the colours (that we may roughly estimate to be ~0.01 mag), in the [Na/O] values (~0.1 dex, which given the slope of the relation also implies an effect of ~0.01 mag in B − V), and evolution of stars off the ZAHB, which does not occur at exactly constant colours.
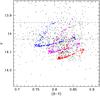 |
Fig. 8 HB stars of 47 Tuc in the V − (B − V) CMD (black dots). Dashed horizontal lines mark the upper and lower magnitude limit of our faint sample. Some synthetic HB models computed by adopting three distinct initial He abundances (Y = 0.26, blue dots, Y = 0.27, magenta dots; and Y = 0.28, red dots) are also shown. See text for details. |
Additional insight is gained by comparing these data with synthetic HBs. These last were estimated using the same procedure as adopted for NGC 1851 (Gratton et al. 2012b) and were computed with a range of different He abundances. For all He abundances, the same average amount of mass lost during the RGB has been adopted. The value adopted is 0.224 M⊙ with a negligible dispersion around it. Note that this is a constant mass offset with respect to that predicted by models of same age but different He abundances at the tip of the RGB, and does not assume strictly the same mass loss law. To compare observations with theoretical predictions, we adopted a reddening E(B − V) = 0.04 and a distance modulus (m − M)V = 13.43. These values are a small adaptation of those listed in the Harris (1996) catalogue to provide a best match to observations.
In this comparison, we first notice that the HB of 47 Tuc has a roughly triangular shape (see Fig. 8). This matches the predictions well if we assume a small spread in He: indeed, He-rich stars are not only brighter, but also describe wider loops while evolving than He-poor stars. As found previously by Di Criscienzo et al. (2010), a small spread of ΔY = 0.02–0.03 can well explain the morphology of the HB of 47 Tuc. We now focus on our faint sample, which spans the whole range in colour of the HB of 47 Tuc, but consists of stars with 13.94 < V < 14.03. This is a narrow strip at the bright extreme of the most populated region of the HB of 47 Tuc. Within this strip, a correlation between He abundance and colour might be expected if there is no significant fraction of stars with Y ≥ 0.28. HB stars with He abundances lower than this value cross the observed strip only during their late evolution at magnitudes brighter than the ZAHB, at a colour that depends on their He abundance. Stars with Y > 0.28 would rather spend most of their HB life within the observed magnitude strip, making a wide loop in colour: many of them would be quite red, and since they would also likely be Na-rich and O-poor, the correlation between B − V colour and Na/O should be much weaker than observed.
A more detailed comparison between observations and theoretical predictions is hampered by several – usually neglected – possible sources of uncertainty that may become important at this level. A short list would include the treatment of superadiabatic convection and the color-Teff relations used for transferring the models to the observational planes. However, three conclusions are likely robust: (i) There is a spread in He abundances within 47 Tuc; (ii) this spread is narrow (0.26 < Y < 0.28); and (iii) there is only very limited room for star-to-star variations in the total mass lost when ascending the RGB.
This last result apparently contrasts with the finding of strong star-to-star variations in the mass loss rates found by some authors for red giants in 47 Tuc by modelling the Hα profiles (see e.g. McDonald & van Loon 2007). While we underline that ours is an empirical result based on evolutionary models, we notice that the mass loss rate measures are instantaneous values that may differ substantially from the values integrated over the whole RGB phase, since it is very likely that mass loss is episodic (see e.g. Origlia et al. 2007). We also note that our result does not exclude that a small minority of stars in 47 Tuc have very different mass loss histories due e.g. to evolution within binary systems (see e.g. Mohler et al. 2000 and Knigge et al. 2008).
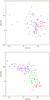 |
Fig. 9 Upper panel: Na-O anticorrelation for HB stars in M 5; filled red squares are RHB stars, blue open squares are BHB stars. Lower panel: the same for RGB stars (from Carretta et al. 2009a). In this panel, we plotted with different symbols stars that might be expected to have descendants on the VBHB (stars bluer than the Grundahl jump: filled violet circles), BHB (open blue squares), RR Lyrae (filled green pentagons), and RHB (filled red squares) (see text). |
4.2.2. M 5
Figure 9 compares the Na-O anticorrelation for stars on the HB of M 5 with those on the RGB (these last are taken from Carretta et al. 2009a). To understand this comparison we recall that at variance with 47 Tuc, M 5 has a very broad HB and our sample has considerable selection effects. We may divide the HB of M 5 into four sections:
-
Very blue HB stars (VBHB, here stars with MV < 0.9): these stars arewarmer than the Grundahl jump. We estimated that theyrepresent 33% of the total HB stars from counts on the HST data byPiotto et al. (2002), analysed as in Grattonet al. (2010). Their atmospheres are in radiativeequilibrium and the chemical abundances are very different fromthe original ones due to sedimentation and radiative levitationeffects (see Behr et al. 1999). For this reason we didnot include these stars in our sample.
-
BHB stars, here stars redder than VBHB stars, but bluer than the instability strip, that is with (B − V)0 < 0.15. Following the same procedure as described above, we estimate that these stars represent 28% of the M 5 HB population. We have 61 such stars in our sample.
-
RR Lyrae variables. M 5 has a very rich population of these variables, representing some 26% of the total HB population. We did not observe them because they should be observed close to minimum to obtain reliable results, which is not practical for multi-object observations in service mode.
-
RHB stars, that is, stars redder than the instability strip. They represent about 13% of the M 5 HB stars. We observed 30 stars in this group; however, a significant fraction of them (12 out of 30) are distinctly brighter than the others, and are probably evolved objects on their way towards the asymptotic giant branch (AGB), although they may be also massive objects resulting from the evolution of binary systems. Incidentally, the ratio of BHB/RHB among the stars we analysed is close to the actual ratio of BHB/RHB stars in M 5.
Also for comparison, we recall that Carretta et al. (2009a) classified 27% of the RGB stars as belonging to the primordial population, 66% to the intermediate population, and 7% to the extreme population for this cluster. If the colours of the stars along the HB are mainly influenced by their He content and the [Na/O] ratio, the Na-O anticorrelation is not completely sampled by the HB stars considered in this paper. We expect to find very few extremely O-poor stars, because they likely spend most of their HB life as VBHB stars. However, a few of them might be present because at the late stages of their HB evolution, stars originally on the VBHB cross the BHB region. We likely also missed several moderately Na-rich/O-poor stars that probably are on the instability strip.
To clarify these rough expectations (which neglect the effect of evolution off the ZAHB, which is significant), we marked with different symbols stars with different values of the [Na/O] ratio in the right panel of Fig. 9; the descendants of these different groups of stars are expected to mainly populate the VBHB, BHB, the instability strip, and the RHB according to their [Na/O] ratio. Once this is taken into account, we find that, as expected, RHB stars have high O and low Na abundances (see also Fig. 10, where we display the run of the [Na/O] ratio with B − V colours), and that we missed the extreme O-poor stars almost completely, likely because they are on the VBHB. On the other hand, while we indeed found a Na-O anticorrelation among BHB stars, the [Na/O] values of most stars on the BHB are similar to those of stars on the RHB (they can therefore be interpreted as objects belonging to the primordial population), and the scatter of [Na/O] values for these stars is large. Part of these results may be attributed to observational errors (which are quite large for BHB stars) and to evolution off the ZAHB. However, at variance with the case of 47 Tuc, presumably some additional scatter in mass loss should also be included to explain our data for M 5. This is suggested by the comparison with a synthetic HB shown in Fig. 11. The theoretical computations were made in the same way as for 47 Tuc; however, in this case we assumed that helium is uniformly distributed in the range 0.248 < Y < 0.288, but we also have to assume that mass loss has a Gaussian distribution with an rms of 0.03 M⊙ to have a reasonable number of He-poor stars on the BHB. Note that this synthetic HB does not reproduce the distribution of stars along the HB of M 5 in detail since stars at the blue extreme of the HB are under-represented. According to the definitions given above, the synthetic HB contains about 7% VBHB against an observed population of 33%. This indicates that there are more very He-rich stars than assumed in this simulation. This is not relevant in the present discussion, which focuses on a few qualitative features that are required to explain the observations, which exclude VBHB stars, however. The lower panel of Fig. 11 displays the run of He with colours for stars in this synthetic HB. The distribution of stars in this plot matches the observed run with colours of the [Na/O] and [N/Fe] abundance ratios quite well, if the quite large observational errors in the [Na/O] values for BHB stars are taken into account.
We conclude that the observations of M 5 on the whole do not contradict the scheme where variations in the He abundances might contribute to explain the HB of this cluster; however, in this case we should also assume the presence of an additional source of substantial scatter in the mass loss rates of stars climbing up the RGB. This is reminiscent of the small range in He abundances along the HB of M 3, as discussed by Catelan et al. (2009); a similar argument was already presented for the same M 5 by Crocker et al. (1988). On the other hand, we should recall that the relation between variations in He and Na and O abundances may be not simple (see e.g. Marcolini et al. 2009).
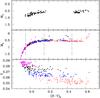 |
Fig. 11 Upper panel: observed HB stars of M5 in the MV − (B − V)0 CMD. Middle panel: synthetic HB computed with parameters appropriate to M 5, and a uniform distribution of helium abundances in the range 0.248 < Y < 0.288. Stellar masses assume a Gaussian distribution with an rms of 0.03 M⊙ around a value that is the same for all He contents. When transforming a theoretical CMD into an observational one, we assume a reddening of E(B − V) = 0.03 and a distance modulus of (m − M)V = 14.46. Lower panel: run of He abundances for the simulated stars with B − V colour. |
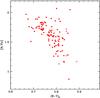 |
Fig. 12 Run of the [N/Fe] ratio with B − V colour along the RHB of 47 Tuc. Symbols are as in Fig. 4. |
4.3. Nitrogen
We were able to derive a hint about the N abundance for stars on the RHB of 47 Tuc, using a number of CN lines. The actual N abundance depends on the value we assume for the C abundance, for which we have no diagnostic. We assumed [C/Fe] = −0.6, which is a typical value for field HB stars (Gratton et al. 2000). Figure 12 displays the run of the [N/Fe] abundances with (B − V) colour in 47 Tuc: there is a very tight anti-correlation. Since we expect that Na-rich/O-poor stars be also N-rich (O being transformed into N), this result strongly supports that obtained for the [Na/O] ratio.
CN lines are too weak to be measurable in our spectra of RHB stars of M 5. On the other hand, the NI line at 8216 Å could be measured on the spectra of BHB stars (as we did for BHB stars in NGC 1851, see Paper II). Figure 13 displays the run of these [N/Fe] abundances with (B − V) colour. In this case we also obtain an anticorrelation, mainly driven by the high N abundances we obtain for the warmer stars. Again, this supports the result we obtained from the [Na/O] ratio.
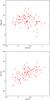 |
Fig. 14 Upper panel: run of the [Mg/Fe] ratio with [Na/O] ratio for stars in 47 Tuc. Lower panel: the same for the [Al/Fe] ratio. Symbols are as in Fig. 4. |
4.4. Mg and Al
Both Mg (from the MgI line at 8213 Å) and Al (from the doublet at 7835-36 Å) abundances were obtained for RHB stars in 47 Tuc. Figure 14 displays the run of [Mg/Fe] and [Al/Fe] with [Na/O] for stars along the HB of 47 Tuc. We found a clear correlation between [Al/Fe] and [Na/O], while there is no convincing trend for [Mg/Fe]. This result is not surprising, given that the range of [Al/Fe] is quite limited (~0.4) dex, and significant Mg depletion is only expected for [Al/Fe] > 1.
Al lines are too weak to be detected in RHB stars of M 5. The run of [Mg/Fe] with (B − V) colour for stars in this clusters is shown in Fig. 15. Mg abundances were derived from the MgI line at 8213 Å in RHB stars, and from the MgII lines at 7877–96 Å in BHB stars. Results for most of the stars are compatible with a single Mg abundance within the errors. Indication for a high Mg depletion is only obtained for one of the hottest BHB star (#25489).
4.5. Barium
The significant correlation between the abundances of proton and n-capture processing might be an indication of a contribution by thermally pulsating stars of moderate mass to the nucleosynthesis required to explain the observed Na-O anticorrelation. Thermally pulsating stars should also produce primary CNO elements. A star-to-star variation in the sum of CNO elements might be revealed as a broadening or splitting in the subgiant branch. Such a splitting has been observed in a few globular clusters, including 47 Tuc but not M 5 (see Piotto et al. 2012; note however that such a splitting might also be explained as due to an age spread).
Alves-Brito et al. (2005) did not find any sign of a correlation between Ba and Na abundances from high-dispersion spectra of four RGB and one RHB star in 47 Tuc. A similar lack of correlation was obtained by D’Orazi et al. (2010) from moderately high resolution spectra of a large number of RGB stars, and by Worley & Cottrell (2012) from moderate-resolution spectra of RGB stars. However, these samples are either very limited or based on data of insufficient quality to reveal subtle trends and therefore cannot be considered as conclusive.
The only line of an n-capture element detectable in our spectra of RHB stars is the BaII line at 5853.69 Å, which is usually considered a good diagnostic with a negligible hyperfine structure and small non-LTE corrections (Mashonkina & Zhao 2006). In the Sun, Ba is predominantly produced by the s-process (Kappeler et al. 1989). The same likely occurs in 47 Tuc (Brown & Wallerstein 1992; James et al. 2004; Alves-Brito et al. 2005; Wylie et al. 2006), while the low Ba/Eu ratio of M 5 stars suggests that for this cluster Ba is mainly produced by the r-process (Ivans et al. 1999, 2001; Yong et al. 2008).
Figure 16 displays the run of [Ba/Fe] with [Na/O] for stars in 47 Tuc. Once we eliminate the C-star #81468 (see below), there is a weak but significant correlation between these two quantities; the Pearson linear correlation coefficient is r = 0.350 over 106 stars, which is significant at a very high level of confidence. A slightly higher and consequently more significant value of r = 0.390 is obtained for the Spearman rank coefficient. However, we cannot entirely exclude some analysis effect, because [Na/O] is correlated with temperature along the HB, and the total range in [Ba/Fe] is only ~0.2 dex. A confirmation of this result is necessary before it can be considered definitive proof of a real correlation between the abundances of p- and n-capture elements in 47 Tuc.
Since there is no observation of a splitting of the subgiant branch, we did not expect and indeed did not find any correlation between [Ba/Fe] and [Na/O] for M 5.
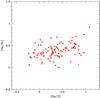 |
Fig. 16 Run of the [Ba/Fe] ratio with [Na/O] ratio for stars in 47 Tuc. Symbols are as in Fig. 4. |
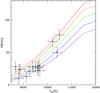 |
Fig. 17 Run of the equivalent width of the 5876 Å HeI feature as a function of Teff for stars on the BHB of M 5. Lines are predictions for different helium abundances [He/H] = −0.4, −0.2, 0, +0.2, and +0.4, from bottom to top. |
4.6. Helium
We observed the HeI feature at 5876 Å (actually, a close multiplet) in the spectra of the warmer BHB stars in our sample for M 5. Figure 17 displays the run of the equivalent width of this feature as a function of temperature, along with typical error bars of ± 8 mÅ in the equivalent width and ± 200 K in the effective temperatures. These values are compared with predictions for different values of the He abundances (here expressed in terms of [He/H], with reference to an adopted solar value of 0.1 by number of atoms). There clearly is a large scatter that prevents determination of a sensible value for individual stars. However, if we average the values we obtain for stars with Teff > 9000 K, we obtain an average of [He/H] = −0.16 ± 0.08, which corresponds to an He abundance in mass of Y = 0.22 ± 0.03. This value is lower than the value of Y ~ 0.26 expected if these stars have a cosmological He abundance increased by the (small) effect of the first dredge-up (Sweigart 1987). However, the difference is only marginally larger than the observational error and may be attributed to several possible defects in the analysis. It suggests that these stars are not significantly enriched in He. This agrees with the moderate [Na/O] ratio obtained for BHB stars. We repeat that this does not mean that there is no He-rich population in M 5, rather that this population should populate the VBHB, and would not be sampled by our observations. This of course sets a limit to the number of very He-rich stars that are possibly present in M 5, since the VBHB stars constitute 33% of the total of HB stars. This fraction is lower than predicted by e.g. D’Antona & Caloi (2008).
We measured a quite large equivalent width of the He line for two of the hottest stars in our sample (#21765, Teff = 10 227 K, and #26450, Teff = 10 500 K; equivalent widths of 67 and 77 mÅ, respectively). Taken at face values, these equivalent widths indicate a very high He abundance ([He/H] ~ 0.35, that is Y = 0.47). Star #26450 is also very O-poor ([O/Fe] = −0.40), but star #21765 is quite O-rich ([O/Fe] = 0.33). Given the large errors in our He abundances for individual stars (about 0.3 dex for these stars, mainly due to uncertainties in the equivalent widths), we do not attach much value to this occurrence.
A comparison with the very similar analysis we performed in Paper II for stars in NGC 1851 (where we obtained Y = 0.29 ± 0.05) suggests that the BHB stars observed in that cluster are more He-rich than those in M 5. This agrees with expectations based on synthesis of the HB populations (see discussion in Paper II).
4.7. Full width at half maximum and rotation
A number of HB stars are known to be fast rotators (see discussion in Cortés et al. 2009). We examined the full width at half maximum (FWHM) of the cross-correlation profile for evidence of rotation. Values of the FWHM are listed in Tables 2 and 3. The run of the FWHM with dereddened (B − V)0 colours is plotted in Fig. 18.
In 47 Tuc no star has abnormally high values of the FWHM that would indicate a fast rotation. However, there is a strong positive correlation between the FWHM and the temperature of the stars. Also, stars of the bright group have systematically higher values of the FWHM. Once deconvolved for the widening caused by the width of the template lines and the instrumental profile (16.1 kms-1), the intrinsic FWHM values range from 15 kms-1 for the cooler stars to 20 kms-1 for the warmer ones, with the bright group stars having a FWHM about 3 kms-1 higher than the faint group ones. We attribute this effect to star-to-star variations of the macroturbulence velocity. The values we found are higher than but not incompatible with, those found by Carney et al. (2008a), who also found a strong correlation between macroturbulence velocity and effective temperature among field RHB stars.
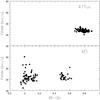 |
Fig. 18 Run of the FWHM of the cross-correlation profiles with dereddened (B − V)0 colours for 47 Tuc and M 5 (upper and lower panel, respectively). |
In M 5, similar trends (though noisier) are observed for RHB stars, while for BHB stars, the FWHM decreases with increasing temperature, and once appropriate deconvolution for template and instrumental profile are made, it becomes negligible for the warmer stars (Teff warmer than ~9500 K), whose atmospheres are expected to be in radiative equilibrium. In addition, one RHB star (#21869) and five BHB stars (#15529, #21180, #28804, #31189, and #32246) have much broader lines than the remaining ones and are likely fast rotators, with #21180 having an intrinsic FWHM ~ 42 kms-1 and all the other fast-rotating stars with intrinsic FWHM ~ 30−33 kms-1. While fast rotators are common among BHB stars (Cortés et al. 2009), they are much rarer among RHB ones. Among field RHB stars, the record holder is HD 195636, which rotates at Vrot sini = 22.2 ± 1.0 kms-1 (Carney et al. 2008b). While we did not calibrate line broadening in terms of rotational velocity, we estimate that #21869 in M 5 likely has a rotational velocity similar to HD 195636. Star #21869 possibly has a variable radial velocity: there is a 3.2 kms-1 offset between measures made from gratings HR12 and HR19, which were taken one week apart, while the average offset for RHB stars is 0.4 kms-1 with an rms of 0.56 kms-1. This star then deviates five times from the typical rms. In addition, #21869 is the most Ba-rich star of our sample, and is both Na and O-rich (but not C-rich). We therefore suspect that #21869 is a spectroscopic binary and that its companion is probably a white dwarf, progeny of the evolution of a rather massive AGB star. It is interesting to note that #21869 is the brightest and one of the reddest among the observed RHB stars of M 5.
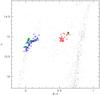 |
Fig. 19 Colour-magnitude diagram for M 5. Blue and red open symbols are slow-rotator BHB and RHB stars, respectively. Green asterisks are fast rotators. Dots are stars that were not observed. |
We also note that four out of five of the BHB fast-rotators are overluminous with respect to the remaining blue HB stars (see Fig. 19). We found a similar result for the only likely fast rotator found in NGC 1851 (Paper II). No similar correlation between rotation and evolution off the ZAHB was noticed so far (Cortés et al. 2009). This point will be re-examined in a future paper.
4.8. Star #81468: A C-star on the HB of 47 Tuc
Star #81486 (the reddest and among the brightest stars observed in 47 Tuc) is a C-star. The spectrum is very rich of CN-lines (see Fig. 4). The star is out of the mean loci of the O-Na anticorrelation defined by the other stars, being O-rich for its Na abundance. It is also very Ba-rich ([Ba/Fe] = 1.48). The most likely explanation of its composition is pollution by a previous low-mass AGB star (currently a white dwarf) in a binary system. However, these systems typically have periods around ~1000 days, hence we do not expect to find variations of radial velocities because the spectra with gratings HR12 and HR19 of 47 Tuc were taken on the same night. Lines are not wider than those of other stars in 47 Tuc and the radial velocity is coincident with the average of the cluster.
5. Conclusions
We presented an analysis of the composition of large samples of stars on the HB of 47 Tucanae and M 5. For the first cluster, which is the prototype of metal-rich GCs with only RHB stars, there are only limited selection effects. For the second we limited our analysis to the RHB and to the BHB stars (in our nomenclature the latter includes stars warmer than the RR Lyraes but cooler than the Grundahl et al. 1999 jump). We excluded from our sample RR Lyrae variables and stars warmer than 11 000 K (in our nomenclature, VBHB stars), for which our analysis would not have provided reliable results. These two sections of the HB include less than half of the HB stars in M 5, so that appropriate care must be taken when examining results.
In 47 Tuc we found tight relations between colours of the stars and their abundances of p-capture elements. We can predict quite accurately (within 0.016 mag in B − V) the colour of an HB star in our faint sample (that is, in the restricted magnitude range 13.94 < V < 14.03) from its [Na/O] ratio. Similar good correlations exist for other elements, including N and Al. This strongly supports the idea that the He content – which is expected to be closely correlated with the abundances of p-capture elements – is the third parameter (in addition to overall metallicity and age) that determines the colours of HB stars. This agrees with the results of Nataf et al. (2011), who used this argument to discuss the radial segregation of first- and second-generation stars. Synthetic HB simulations performed for this specific project show that the He abundance spread among the HB stars in 47 Tuc is likely small (ΔY < 0.03). This result provides plain support to the analysis performed by Di Criscienzo et al. (2010) and Milone et al. (2012). If we transform the spread in colour of HB stars at a given [Na/O] in terms of mass of the stars, the scatter is only 0.016 M⊙ once it is deconvolved for the (quite small) observational errors. This leaves only limited room for additional factors to influence mass loss along the RGB, at least for this cluster.
There possibly is a correlation between the abundances of p- and n-capture elements in 47 Tuc, although the total range in Ba abundances is small (~0.2 dex) and there is the chance that this trend is due to analysis errors. If confirmed by a more accurate analysis, this might suggest that AGB stars of moderate mass contributed to the gas from which second generation stars formed in this cluster.
Considering the selection effects in our sample is important to understand the results for M 5. In this case, we find that, as expected, RHB stars are Na-poor and O-rich, and therefore likely belong to the primordial population. There is a clear correlation of the [Na/O] ratio and N abundances with colour along the BHB. A derivation of the He abundance for stars in the temperature range 9000 < Teff < K yields a low value of Y = 0.22 ± 0.03. This is expected, since HB stars of a putative He-rich population in this cluster should be warmer than 11 000 K, and are accordingly not sampled by our analysis. However, while an overall correlation between abundances of p-capture elements and colours exists for star along the HB of M 5, our data suggest that there should be an additional source of scatter in the total mass loss of RGB stars, at a level of ~0.03 M⊙; this is more than the scatter observed for the 47 Tuc stars. Additional observations (e.g. rotational velocities from higher resolution spectra than used in this paper) are required to understand the mechanism responsible for this additional scatter.
On the whole, results for these two clusters conform very well to the paradigm that the distribution of stars along the HB of a GC is determined by their initial He content and is therefore strongly related to the multiple population phenomenon. They also show that this comparison requires some care in examining the results for individual clusters.
We also note that there are six fast rotators on the HB of M 5. Fast rotators are known to be present among HB stars of several GCs, most of them being on the BHB (Cortés et al. 2009). The fraction of fast rotating BHB stars strongly varies from cluster to cluster. In addition, both in M 5 and in NGC 1851 (considered in Paper II), we found that fast-rotating stars are overluminous with respect to other BHB stars; this also might be different from what was found in other GCs. We will examine these questions in more detail in a forthcoming paper.
Finally, we found a C-star on the HB of 47 Tuc and a Ba-rich, fast-rotating, likely binary star on the HB of M 5. The unusual composition of these stars is probably due to mass transfer from thermally pulsing AGB stars, which are now white dwarfs. We note that these two stars are among the brightest and coolest HB stars.
Acknowledgments
This publication makes use of data products from the Two Micron All Sky Survey, which is a joint project of the University of Massachusetts and the Infrared Processing and Analysis Center/California Institute of Technology, funded by the National Aeronautics and Space Administration and the National Science Foundation. This research has made use of the NASA’s Astrophysical Data System. This research has been funded by PRIN INAF “Formation and Early Evolution of Massive Star Clusters”. We thank the anonymous referee for a careful revision of the manuscript and many suggestions that improved the paper.
References
- Alonso, A., Arribas, S., & Martinez-Roger, C. 1999, A&AS, 140, 261 [NASA ADS] [CrossRef] [EDP Sciences] [Google Scholar]
- Alonso, A., Arribas, S., & Martinez-Roger, C. 2001, A&A, 376, 1039 [NASA ADS] [CrossRef] [EDP Sciences] [Google Scholar]
- Alves-Brito, A., Barbuy, B., Ortolani, S., et al. 2005, A&A, 435, 657 [NASA ADS] [CrossRef] [EDP Sciences] [Google Scholar]
- Behr, B. B., Cohen, J. G., McCarthy, J. K., & Djorgowski, S. G. 1999, ApJ, 517, L135 [NASA ADS] [CrossRef] [Google Scholar]
- Briley, M. M. 1997, AJ, 114, 1051 [NASA ADS] [CrossRef] [Google Scholar]
- Brown, J. A., & Wallerstein, G. 1992, AJ, 104, 1818 [NASA ADS] [CrossRef] [Google Scholar]
- Cardelli, J. A., Clayton, G. C., & Mathis, J. S. 1989, ApJ, 345, 245 [NASA ADS] [CrossRef] [Google Scholar]
- Carney, B. W., Latham, D. W., Stefanik, R. P., & Laird, J. B. 2008a, AJ, 135, 196 [NASA ADS] [CrossRef] [Google Scholar]
- Carney, B. W., Gray, D. F., Yong, D., et al. 2008b, AJ, 135, 892 [NASA ADS] [CrossRef] [Google Scholar]
- Carretta, E., Bragaglia, A., Gratton, R., et al. 2009a, A&A, 505, 117 [NASA ADS] [CrossRef] [EDP Sciences] [Google Scholar]
- Carretta, E., Bragaglia, A., Gratton, R., & Lucatello, S. 2009b, A&A, 505, 139 [NASA ADS] [CrossRef] [EDP Sciences] [Google Scholar]
- Carretta, E., Bragaglia, A., Gratton, R., D’Orazi, V., & Lucatello, S. 2009c, A&A, 508, 695 [NASA ADS] [CrossRef] [EDP Sciences] [Google Scholar]
- Carretta, E., Bragaglia, A., Gratton, R., et al. 2010, A&A, 516, A55 [NASA ADS] [CrossRef] [EDP Sciences] [Google Scholar]
- Catelan, M., & de Freitas Pacheco, J. A. 1995 A&A 297, 345 [Google Scholar]
- Catelan, M., Grundahl, F., Sweigart, A. V., Valcarce, A. A. R., & Cortés, C. 2009, ApJ, 695, L97 [NASA ADS] [CrossRef] [Google Scholar]
- Cortés, C., Silva, J. R. P., Recio-Blanco, A., et al. 2009, A&A, 704, 750 [Google Scholar]
- Crocker, D.A, Rood, R. T., & O’Connell, R. W. 1988, ApJ, 332, 236 [NASA ADS] [CrossRef] [Google Scholar]
- Cudworth, K. C. 1979, AJ, 84, 1866 [NASA ADS] [CrossRef] [Google Scholar]
- D’Antona, F., & Caloi, V. 2004, ApJ, 611, 871 [NASA ADS] [CrossRef] [Google Scholar]
- D’Antona, F., & Caloi, V. 2008, MNRAS, 390, 693 [NASA ADS] [CrossRef] [Google Scholar]
- D’Antona, F., Caloi, V., Montalban, J., et al. 2002, A&A, 395, 69 [NASA ADS] [CrossRef] [EDP Sciences] [Google Scholar]
- Di Criscienzo, M., Ventura, P., D’Antona, F., Milone, A., & Piotto, G. 2010, MNRAS, 408, 999 [NASA ADS] [CrossRef] [Google Scholar]
- D’Orazi, V., Gratton, R., Lucatello, S., et al. 2010, ApJ, 719, L213 [NASA ADS] [CrossRef] [Google Scholar]
- Dotter, A., Sarajedini, A., Anderson, J., et al. 2010, ApJ, 708, 698 [NASA ADS] [CrossRef] [Google Scholar]
- Faulkner, J. 1966, ApJ, 144, 978 [NASA ADS] [CrossRef] [Google Scholar]
- For, B.-Q., & Sneden, C. 2010, AJ, 140, 1694 [NASA ADS] [CrossRef] [Google Scholar]
- Gratton, R. G., Carretta, E., Eriksson, K., & Gustafsson, B. 1999, A&A, 350, 955 [NASA ADS] [Google Scholar]
- Gratton, R., Sneden, C., Carretta, E., & Bragaglia, A. 2000, A&A, 354, 169 [Google Scholar]
- Gratton, R., Sneden, C., & Carretta, E. 2004, ARA&A, 42, 385 [NASA ADS] [CrossRef] [Google Scholar]
- Gratton, R. G., Carretta, E., Bragaglia, A., Lucatello, S., & D’Orazi, V. 2010, A&A, 517, 81 [Google Scholar]
- Gratton, R. G., Lucatello, S., Carretta, E., et al. 2011, A&A, 534, A123 (Paper I) [NASA ADS] [CrossRef] [EDP Sciences] [Google Scholar]
- Gratton, R. G., Carretta, E., & Bragaglia, A. 2012a, A&ARv, 20, 50 [CrossRef] [Google Scholar]
- Gratton, R. G., Lucatello, S., Carretta, E., et al. 2012b, A&A, 539, A19 (Paper II); Corrigendum: 547, C2 [NASA ADS] [CrossRef] [EDP Sciences] [Google Scholar]
- Grundahl, F., Catelan, M., Landsman, W. B., Stetson, P. B., & Andersen, M. I. 1999, ApJ, 524, 242 [NASA ADS] [CrossRef] [Google Scholar]
- Harris, W. E. 1996, AJ, 112, 1487 [NASA ADS] [CrossRef] [Google Scholar]
- Ivans, I. I., Sneden, C., Kraft, R. P., et al. 1999, AJ, 118, 1273 [NASA ADS] [CrossRef] [Google Scholar]
- Ivans, I. I., Kraft, R. P., Sneden, C., Smith, et al. 2001, AJ, 122, 1438 [NASA ADS] [CrossRef] [Google Scholar]
- James, G., François, P., Bonifacio, P., et al. 2004, A&A, 427, 825 [NASA ADS] [CrossRef] [EDP Sciences] [Google Scholar]
- Kappeler, F., Beer, H., & Wisshak, K. 1989, RPPh, 52, 945 [Google Scholar]
- Knigge, C., Dieball, A., Maiz Apellaniz, J., et al. 2008, ApJ, 683, 1006 [NASA ADS] [CrossRef] [Google Scholar]
- Lai, D. K., Smith, G. H., Bolte, M., et al. 2011, AJ, 141, 62 [NASA ADS] [CrossRef] [Google Scholar]
- Lee, Y.-W., Demarque, P., & Zinn, R. 1994, ApJ, 423, L248 [Google Scholar]
- Marcolini, A., Gibson, B. K., Karakas, A. I., & Sánchez-Blázquez, P. 2009, MNRAS, 395 719 [Google Scholar]
- Marino, A. F., Villanova, S., Milone, A. P., et al. 2011, ApJ, 730, L16 [NASA ADS] [CrossRef] [Google Scholar]
- Mashonkina, L., & Zhao, G. 2006, A&A, 456, 313 [NASA ADS] [CrossRef] [EDP Sciences] [Google Scholar]
- Mashonkina, I. I., Shimanskii, V. V., & Sakhibullin, N. A. 2000, Astron. Rep. 44, 790 [Google Scholar]
- McDonald, I., & van Loon, J. Th. 2007, A&A, 476, 1261 [NASA ADS] [CrossRef] [EDP Sciences] [Google Scholar]
- Milone, A. P., Piotto, G., Bedin, L. R., et al. 2012, ApJ, 744, 58 [NASA ADS] [CrossRef] [Google Scholar]
- Mohler, S., Landsman, W. B., & Dorman, B. 2000, A&A, 361, 937 [NASA ADS] [Google Scholar]
- Momany, Y., Bedin, L. R., Cassisi, S., et al. 2004, A&A, 420, 605 [NASA ADS] [CrossRef] [EDP Sciences] [Google Scholar]
- Nataf, D. M., Gould, A., Pinsonneault, M. H., & Stetson, P. B. 2011, ApJ, 736, 94 [NASA ADS] [CrossRef] [Google Scholar]
- Norris, J., & Freeman, K. C. 1982, ApJ, 243, 143 [NASA ADS] [CrossRef] [Google Scholar]
- Norris, J., Cottrell, P. L., Freeman, K. C., & Da Costa, G. S. 1981, ApJ, 244, 205 [NASA ADS] [CrossRef] [Google Scholar]
- Origlia, L., Rood, R. T., Fabbri, S., et al. 2007, ApJ, 667, L85 [NASA ADS] [CrossRef] [Google Scholar]
- Pasquini, L., Castillo, R., Dekker, H., et al. 2004, SPIE, 5492, 136 [Google Scholar]
- Peterson, R. 1983, ApJ, 275, 737 [NASA ADS] [CrossRef] [Google Scholar]
- Piotto, G., King, I. R., Djorgovski, S. G., et al. 2002, A&A, 391, 945 [NASA ADS] [CrossRef] [EDP Sciences] [Google Scholar]
- Piotto, G., Villanova, S., Bedin, L. R., et al. 2005, ApJ, 621, 777 [NASA ADS] [CrossRef] [Google Scholar]
- Piotto, G., Milone, A. P., Anderson, J., et al. 2012, ApJ, in press [arXiv:1208.1873] [Google Scholar]
- Przybilla, N., & Butler, K. 2001, A&A 379, 955 [Google Scholar]
- Robin, A. C., Reylé, C., Derrière, S., & Picaud, S. 2003, A&A, 409, 523 [NASA ADS] [CrossRef] [EDP Sciences] [Google Scholar]
- Sandage, A., & Wallerstein, G. 1960, ApJ, 131, 598 [NASA ADS] [CrossRef] [Google Scholar]
- Skrutskie, M. F., Cutri, R. M., Stiening, R., et al. 2006, AJ, 131, 1163 [NASA ADS] [CrossRef] [Google Scholar]
- Sweigart, A. V. 1987, ApJS, 65, 955 [NASA ADS] [CrossRef] [Google Scholar]
- Takeda, Y. 1997, PASJ, 49, 471 [NASA ADS] [Google Scholar]
- Villanova, S., Piotto, G., & Gratton, R. G. 2009, A&A, 499, 755 [NASA ADS] [CrossRef] [EDP Sciences] [Google Scholar]
- Villanova, S., Geisler, D., Piotto, G., & Gratton, R. G. 2012, ApJ, 748, 62 [NASA ADS] [CrossRef] [Google Scholar]
- Worley, C. C., & Cottrell, P. L. 2012, PASA, 29, 29 [NASA ADS] [CrossRef] [Google Scholar]
- Wylie, E. C., Cottrell, P., Sneden, C. A., & Lattanzio, J. C. 2006, ApJ, 649, 248 [NASA ADS] [CrossRef] [Google Scholar]
- Yong, D., Karakas, A. I., Lambert, D. L., Chieffi, A., & Limongi, M. 2008, ApJ, 689, 1031 [NASA ADS] [CrossRef] [Google Scholar]
All Tables
Basic data for programme stars in 47 Tuc (complete table available only electronically at CDS).
Basic data for programme stars in M 5 (complete table available only electronically at CDS).
Abundances of Fe, O, Na, and Al in HB stars of 47 Tuc (complete table available only electronically at CDS).
Abundances of Si, Ca, Ti, V, Mn, Ni, and Ba in HB stars of 47 Tuc (complete table available only electronically at CDS).
Elemental abundances in HB stars of M 5 (complete table available only electronically at CDS).
All Figures
|
Fig. 1 Colour–magnitude diagram of 47 Tuc. Circles are the stars analysed in this paper: red symbols are our faint stars group, while the blue ones are the bright stars group. Dots are stars not observed in this paper. |
| In the text | |
|
Fig. 2 Colour–magnitude diagram of 47 Tuc. Triangles are the stars analysed in this paper: green symbols are our faint stars group, while the magenta ones are the bright stars group. Dots are stars not observed in this paper. For comparison, location of ZAHB stars of different masses and He abundances (Y = 0.25: red dots and solid line; Y = 0.28: blue dots and solid line), the evolutionary tracks off the ZAHB for stars of 0.65 M⊙ (dashed lines) are also plotted. |
| In the text | |
|
Fig. 3 Colour–magnitude diagram of M 5. Red circles are RHB stars, blue circles are BHB stars. Dots are stars not observed in this paper. |
| In the text | |
|
Fig. 4 Portion of the spectra of three RHB stars of 47 Tuc (#92985: upper row; #81468: middle row; #44226: lower row). The first two spectra are offset vertically for clarity. These spectra have been shifted at zero radial velocity; telluric features are excised following the technique described in the text. Dashed lines mark the NaI doublet at 8183-94 Å; the dotted line marks the strongest CN line in this spectral region (many other CN lines are present). Note that #81468 is a C-star, discussed in Sect. 4.8. |
| In the text | |
|
Fig. 5 Upper panel: Na-O anticorrelation for HB stars in 47 Tuc; filled squares are the faint stars group, open triangles are the bright stars group. Lower panel: the same for RGB stars (from Carretta et al. (2009a) |
| In the text | |
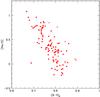 |
Fig. 6 Run of the [Na/O] ratio with B − V colour along the HB of 47 Tuc. Symbols are as in Fig. 5. |
| In the text | |
|
Fig. 7 Upper panel: run of the [Na/Fe] ratio with B − V colour along the HB of 47 Tuc; lower panel: the same for the [O/Fe] ratio. Symbols are as in Fig. 5. |
| In the text | |
|
Fig. 8 HB stars of 47 Tuc in the V − (B − V) CMD (black dots). Dashed horizontal lines mark the upper and lower magnitude limit of our faint sample. Some synthetic HB models computed by adopting three distinct initial He abundances (Y = 0.26, blue dots, Y = 0.27, magenta dots; and Y = 0.28, red dots) are also shown. See text for details. |
| In the text | |
|
Fig. 9 Upper panel: Na-O anticorrelation for HB stars in M 5; filled red squares are RHB stars, blue open squares are BHB stars. Lower panel: the same for RGB stars (from Carretta et al. 2009a). In this panel, we plotted with different symbols stars that might be expected to have descendants on the VBHB (stars bluer than the Grundahl jump: filled violet circles), BHB (open blue squares), RR Lyrae (filled green pentagons), and RHB (filled red squares) (see text). |
| In the text | |
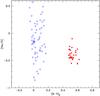 |
Fig. 10 Run of the [Na/O] ratio with B − V colour along the HB of M 5. Symbols are as in Fig. 9. |
| In the text | |
|
Fig. 11 Upper panel: observed HB stars of M5 in the MV − (B − V)0 CMD. Middle panel: synthetic HB computed with parameters appropriate to M 5, and a uniform distribution of helium abundances in the range 0.248 < Y < 0.288. Stellar masses assume a Gaussian distribution with an rms of 0.03 M⊙ around a value that is the same for all He contents. When transforming a theoretical CMD into an observational one, we assume a reddening of E(B − V) = 0.03 and a distance modulus of (m − M)V = 14.46. Lower panel: run of He abundances for the simulated stars with B − V colour. |
| In the text | |
|
Fig. 12 Run of the [N/Fe] ratio with B − V colour along the RHB of 47 Tuc. Symbols are as in Fig. 4. |
| In the text | |
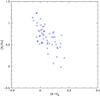 |
Fig. 13 Run of the [N/Fe] ratio with B − V colour along the BHB of M 5. Symbols are as in Fig. 9. |
| In the text | |
|
Fig. 14 Upper panel: run of the [Mg/Fe] ratio with [Na/O] ratio for stars in 47 Tuc. Lower panel: the same for the [Al/Fe] ratio. Symbols are as in Fig. 4. |
| In the text | |
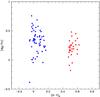 |
Fig. 15 Run of the [Mg/Fe] ratio with (B − V) colour for stars in M 5. Symbols are as in Fig. 9. |
| In the text | |
|
Fig. 16 Run of the [Ba/Fe] ratio with [Na/O] ratio for stars in 47 Tuc. Symbols are as in Fig. 4. |
| In the text | |
|
Fig. 17 Run of the equivalent width of the 5876 Å HeI feature as a function of Teff for stars on the BHB of M 5. Lines are predictions for different helium abundances [He/H] = −0.4, −0.2, 0, +0.2, and +0.4, from bottom to top. |
| In the text | |
|
Fig. 18 Run of the FWHM of the cross-correlation profiles with dereddened (B − V)0 colours for 47 Tuc and M 5 (upper and lower panel, respectively). |
| In the text | |
|
Fig. 19 Colour-magnitude diagram for M 5. Blue and red open symbols are slow-rotator BHB and RHB stars, respectively. Green asterisks are fast rotators. Dots are stars that were not observed. |
| In the text | |
Current usage metrics show cumulative count of Article Views (full-text article views including HTML views, PDF and ePub downloads, according to the available data) and Abstracts Views on Vision4Press platform.
Data correspond to usage on the plateform after 2015. The current usage metrics is available 48-96 hours after online publication and is updated daily on week days.
Initial download of the metrics may take a while.