Fig. 2
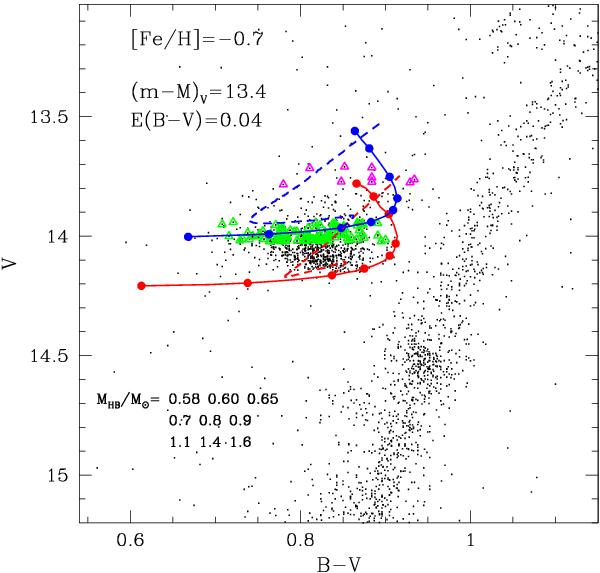
Colour–magnitude diagram of 47 Tuc. Triangles are the stars analysed in this paper: green symbols are our faint stars group, while the magenta ones are the bright stars group. Dots are stars not observed in this paper. For comparison, location of ZAHB stars of different masses and He abundances (Y = 0.25: red dots and solid line; Y = 0.28: blue dots and solid line), the evolutionary tracks off the ZAHB for stars of 0.65 M⊙ (dashed lines) are also plotted.
Current usage metrics show cumulative count of Article Views (full-text article views including HTML views, PDF and ePub downloads, according to the available data) and Abstracts Views on Vision4Press platform.
Data correspond to usage on the plateform after 2015. The current usage metrics is available 48-96 hours after online publication and is updated daily on week days.
Initial download of the metrics may take a while.