Fig. 8
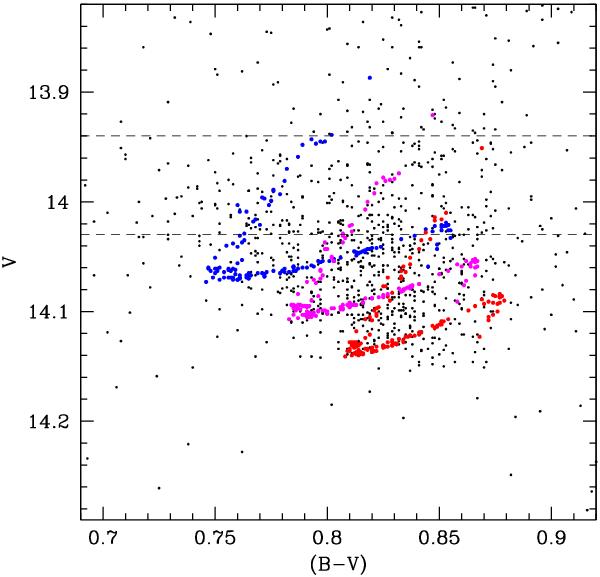
HB stars of 47 Tuc in the V − (B − V) CMD (black dots). Dashed horizontal lines mark the upper and lower magnitude limit of our faint sample. Some synthetic HB models computed by adopting three distinct initial He abundances (Y = 0.26, blue dots, Y = 0.27, magenta dots; and Y = 0.28, red dots) are also shown. See text for details.
Current usage metrics show cumulative count of Article Views (full-text article views including HTML views, PDF and ePub downloads, according to the available data) and Abstracts Views on Vision4Press platform.
Data correspond to usage on the plateform after 2015. The current usage metrics is available 48-96 hours after online publication and is updated daily on week days.
Initial download of the metrics may take a while.