| Issue |
A&A
Volume 549, January 2013
|
|
|---|---|---|
| Article Number | A40 | |
| Number of page(s) | 10 | |
| Section | Atomic, molecular, and nuclear data | |
| DOI | https://doi.org/10.1051/0004-6361/201219974 | |
| Published online | 14 December 2012 | |
Formaldehyde and methylamine reactivity in interstellar ice analogues as a source of molecular complexity at low temperature
Université d’Aix-Marseille, Laboratoire de Physique des Interactions Ioniques et Moléculaires, UMR CNRS 7345, Centre de St-Jérôme, Avenue Escadrille Normandie-Niemen, 13397 Marseille Cedex 20, France
e-mail: This email address is being protected from spambots. You need JavaScript enabled to view it.
Received: 9 July 2012
Accepted: 24 October 2012
Abstract
Context. Laboratory simulations on interstellar or cometary ice analogues are crucial to understand the formation of complex organic molecules that are detected in the interstellar medium (ISM). Results from this work give hints on physical and chemical processes occurring in space and can serve as a benchmark for dedicated space missions.
Aims. The aim of this work is to consolidate the knowledge of ice evolution during the star formation process by investigating the influence of thermal reactions as a source of molecular complexity in the ISM. In this study, we are interested in the thermal reactivity between two interstellar molecules, formaldehyde (H2CO) and methylamine (CH3NH2) in water ice analogues.
Methods. We used Fourier transform infrared spectroscopy, mass spectrometry, and B3LYP calculations to investigate the thermal reaction between formaldehyde and methylamine (14N and 15N) at low temperature in water ice analogues.
Results. We demonstrate that methylamine and formaldehyde quickly react in water ice analogues for astronomically relevant temperatures and form N-methylaminomethanol CH3NHCH2OH. The measured activation energy of this reaction, 1.1 ± 0.05 kJ mol-1 (1.8 ± 0.08 kJ mol-1 with methylamine 15N), allows the reaction to proceed in interstellar ices, when the ices are gently warmed, as it occurs in young stellar objects, in photo-dissociation regions, or in comets. Therefore, CH3NHCH2OH is likely to be found in these objects. This hypothesis is confirmed by numerical simulations that clearly show that the formation of N-methylaminomethanol is likely at low temperature. Isotopic experiments as well as photochemical studies have also been performed to better characterise the ice evolution induced by heat and ultraviolet radiation during star formation.
Key words: astrochemistry / molecular processes / methods: laboratory / ISM: molecules
© ESO, 2012
1. Introduction
Star formation begins with the collapse of a prestellar core inside a molecular cloud to form a protostar, which then grows from material coming from its envelope, and later through an accretion disk, where planets and comets may form. This physical evolution from the molecular cloud to a planetary system is accompanied by chemical evolution induced by heat and ultraviolet (UV) or X-rays radiations from the protostar. Much of this chemical evolution takes place in the icy mantle of interstellar grains, and the aim of this work is to consolidate the knowledge of the ice evolution during the star formation process, and especially the influence of thermal reactions as a source of molecular complexity in the interstellar medium (ISM). In this study, we are interested in the thermal reactivity between two interstellar molecules, formaldehyde (H2CO), and methylamine (CH3NH2) in water ice analogues. Formaldehyde absorption features in interstellar ices observed in young stellar objects (YSOs) in the 5.7−6 μm region (the so-called C1 component) indicate abundances around 6% with respect to water (Boogert et al. 2008). Its formation in ice seems to be well understood and is explained by direct hydrogenation of CO on the grain surface (Hiraoka et al. 1994, 2002; Watanabe et al. 2004). Methylamine CH3NH2 is the simplest member of the primary alkylamine family and has been detected in gas phase by its 202 → 110 Aa state transition in the direction of Sgr B2 and Ori A (Fourikis et al. 1974). In addition, results from the stardust mission support its presence in cometary cores (Elsila et al. 2009). Several pathways of formation either on grain surface or in gas phase have been proposed. Godfrey et al. (1973) suggested its formation on grain surface from the hydrogenation reactions starting on the CN radical (Eq. (1)). This mechanism has recently been experimentally validated starting from HCN (Theule et al. 2011), ![Mathematical equation: \begin{equation} \label{eqmeca} \rm CN \xrightarrow[]{\text{H}} HCN \xrightarrow[]{\text{H}} CH_2NH \xrightarrow[]{\text{H}} CH_3NH_2 . \end{equation}](/articles/aa/full_html/2013/01/aa19974-12/aa19974-12-eq16.png) (1)Gardner & McNesby (1982) and Ogura et al. (1989) proposed its formation from the UV photolysis of a gaseous mixture containing CH4 and NH3. Finally, Herbst (1985) proposed a gas phase methylamine formation from the methylium cation CH
(1)Gardner & McNesby (1982) and Ogura et al. (1989) proposed its formation from the UV photolysis of a gaseous mixture containing CH4 and NH3. Finally, Herbst (1985) proposed a gas phase methylamine formation from the methylium cation CH and NH3. However, solid methylamine has never been detected in ice, so far. This could be due to its low abundance, but also to the difficulty to assign this compound from ices in infrared astronomical spectra. Works on ice analogues containing methylamine suggest that a plausible cause of its non-observation in interstellar ices is its high reactivity at low temperature (Bossa et al. 2009a). Indeed, from a chemical point of view, CH3NH2 is a better nucleophile and base than ammonia. This molecule can quickly react at low temperature in interstellar ice analogues with acids, such as HNCO, HCN, and HCOOH. In addition, methylamine reacts at low temperature with CO2, leading to the formation of methylammonium methylcarbamate (CH3NHCH3NHCOO−), which can be isomerised into glycine under UV irradiation (Bossa et al. 2009a). The measured activation barrier for this latter reaction, 3.7 kJ mol-1, is compatible with low temperature observed in molecular clouds (Bossa et al. 2009a). Among molecules observed in interstellar ices, formaldehyde is of prime interest, since thermally promoted formaldehyde reactions in presence of NH3 at low temperature have shown that they are an important source of organic molecules in astrophysical environments such as comets and interstellar ices (Bossa et al. 2009b; Schutte et al. 1993; Vinogradoff et al. 2011). The resulting products are the polymer of H2CO, the polyoxymethylene (POM), and the aminomethanol (NH2CH2OH) (Bossa et al. 2009b; Schutte et al. 1993).
In this work, we demonstrate that methylamine and formaldehyde quickly react in water ices at low temperature to form N-methylaminomethanol (CH3NHCH2OH). The measured activation energy of this reaction, 1.1 kJ mol-1, implies that this reaction can easily occur in interstellar ices, when the ices are gently warmed, as it is in YSOs, in photo-dissociation regions (PDRs), or in comets. Therefore, CH3NHCH2OH is likely to be found in these objects. This hypothesis is confirmed by numerical simulations, which show that the formation of N-methylaminomethanol is likely at low temperature. Isotopic experiments as well as photochemical studies have also been performed to better characterise ice evolution induced by heat and UV radiation in star-forming regions and cometary environments.
2. Experimental and theoretical section
Methylamine is commercially available as a 99.9995% pure gas from Air Liquide. Methylamine 15N is formed from methylamine (15N)-HCl commercially available from Cambridge Isotope (98%). The H2O/CH3NH2/H2CO gas mixtures are prepared at room temperature into two mixing lines under primary vacuum. The first one for the CH3NH2 gas mixture and the second one for H2CO and H2O, to prevent any gas phase reaction. They are then co-deposited with a chosen ratio onto a gold-plated metal surface cooled to 20 K by a Model 21 CTI cold head within a high vacuum chamber (ca 10-8 mbar). The infrared spectra are recorded between 4000 and 650 cm-1 in the reflexion mode using a Fourier transform infrared spectrometer (FTIR). A typical spectrum has a 1 cm-1 resolution and is averaged over one hundred interferograms. The sample is warmed using a heating resistance, and the temperature is controlled using a Lakeshore Model 331 temperature controller. The mass spectra are recorded using an MKS quadrupole mass spectrometer as the products are being desorbed. The ionisation source is a 70 eV impact electronic source, and the mass spectra are recorded between 1 and 80 amu. The UV radiations (λ > 120 nm) are generated from a microwave discharge hydrogen flow lamp (Opthos instruments) separated from the vacuum chamber by a magnesium fluoride window. Lamp settings during irradiation are PH2 = 300 × 10-3 mbar, microwave forward power 70%, reflected power less than 10%. The distance between the lamp and the ice sample is about 10 cm. The flux has been calibrated with the actinometry method described by Cottin et al. (2003) using the photolysis of methanol. The flux of the hydrogen lamp is 2 × 10¹⁵ photons cm-2 s-1. The concentration ratio of the different mixtures is first set before deposition using standard manometric techniques, and then derived from the infrared spectra by integrating vibrational bands to estimate the column density Nx (molecule cm-2) of CH3NH2, and H2CO according to their band strengths  (cm molecule-1) provided by the literature using
  . For CH3NH2, we used the band strength of the wagging mode at 889 cm-1 of 1.3 × 10⁻¹⁷ cm molecule-1 (Holtom et al. 2005), and for H2CO, we used the values given by Schutte et al. (1993): 9.6 × 10⁻¹⁸ cm molecule-1 for the C=O stretching mode at 1725.5 cm-1 and 4 × 10-18 cm molecule-1 for the CH2 scissoring mode at 1494 cm-1. The thickness of the deposited solid films, assuming a density of 0.92 g cm-3 for H2O, is estimated to be around 0.1 μm. We also used the band integration strengths to monitor the decrease in the reacting infrared band intensities as reactants are consumed during the reaction, and to estimate how much of each product is formed. We estimated the N-methylaminomethanol band strengths assuming that all formaldehyde has been converted into it. Accordingly, knowing the amount of N-methylaminomethanol and using the relation , we calculated the band strengths of the N-methylaminomethanol. We performed a vibrational analysis of the N-methylaminomethanol (CH3NHCH2OH) to compute the harmonic vibrational frequencies for both the 14N and 15N isotopologues. Nevertheless, to simplify this analysis we did not take into account the effect of environment on the calculations. Calculations were performed using the Gaussian 98 package (Frisch et al. 1998; Lee et al. 1988) at the B3LYP/6-31G** level, which is known to supply reliable predictions of vibrational wavenumbers (Duvernay et al. 2004, 2007).
3. Results
3.1. Warming of an H2CO/CH3NH2 ice mixture: N-methylaminomethanol formation
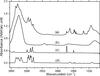 |
Fig. 1 FTIR spectrum of (a) H2O/H2CO/CH3NH2 = 1/0.1/2 ice mixture deposited at 30 K; (b) pure H2O ice deposited at 30 K; (c) pure H2CO ice deposited at 30 K; (d) pure CH3NH2 deposited at 20 K. |
Thermally promoted formaldehyde reactions at low temperature in H2O/NH3/H2CO ices have been studied by Schutte et al. (1993) and Bossa et al. (2009b). These authors distinguished at least two different products: polyoxymethylene (POM) HO(CH2O)nH, the H2CO polymer, and aminomethanol (NH2CH2OH). The nature of the products and their relative abundances depend strongly on the initial composition of the initial ice mixture. Schutte et al. (1993) have shown that NH2CH2OH is the dominant product when NH3 is in excess with respect to H2CO. We chose to adopt the same argument in working with an excess of methylamine to avoid formaldehyde polymerisation. Figure 1 displays the infrared spectrum of an ice mixture of H2O/H2CO/CH3NH2 (1/0.1/2) deposited at 30 K compared with the spectra of pure H2O, H2CO, and CH3NH2 ices. The ice mixture spectrum is dominated by a strong and broad bands caused by the OH and NH stretching modes of H2O and CH3NH2. Formaldehyde is easily characterised from two characteristic bands located at 1715 and 1497 cm-1 caused by the C=O stretching mode and CH bending modes. The infrared absorption bands observed in Fig. 1 can be assigned to initial species only, which indicates the lack of reactivity at 30 K. These infrared absorption bands are listed in Table 1 along with their vibrational assignments and band strengths. This initial ice analogue was then warmed from 30 K to 240 K using different heating rates of 10, 4, 2, 1, and 0.5 K min-1.
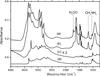 |
Fig. 2 FTIR spectra of (a) H2O/H2CO/CH3NH2 = 1/0.1/2 ice mixture deposited at 30 K and recorded at 30 K; (b) recorded at 70 K; (c) recorded at 190 K; (d) pure aminomethanol (NH2CH2OH) recorded at 190 K. |
Infrared absorption bands and vibrational assignments of CH3NH2 and H2CO in pure solids and in a water ice environment at 20 K.
Figure 2 displays the infrared spectrum of an ice mixture of H2O/H2CO/CH3NH2 (1/0.1/2) deposited at 30 K and then warmed at 4 K min-1. From 45 K, the bands caused by formaldehyde start to decrease and fully disappear at 70 K (Fig. 2b). This range of temperature is lower than expected for formaldehyde sublimation, which in our experimental conditions is observed between 100 and 110 K. At 190 K, it remains on the substrate the reaction product (Fig. 2c). Thus the disappearance of H2CO can only be explained by reactivity. Changing the heating rate from 10 to 0.5 K min-1 does not alter the reactivity. Nevertheless, heating rates in the ISM are expected to be lower than those usually used in laboratory. Heating rates as low as this cannot be investigated in the laboratory, so it is hard to predict in which way they will affect the chemistry. The thermal reactivity of H2CO in ice with NH3 has previously been investigated experimentally and theoretically (Bossa et al. 2009b; Chen & Woon 2011; Rimola et al. 2010; Schutte et al. 1993). This reaction leads to the formation of the aminoalcohol NH2CH2OH, which occurs in a low barrier nucleophilic addition between NH3 and H2CO. The infrared spectrum of the observed product is consistent with an aminoalcohol structure, which in this experiment should be the N-methylaminomethanol (CH3NHCH2OH) (Figs. 2c, and d). Indeed, the spectrum is dominated by a strong band in the NH stretching region at 3260 cm-1, and in the C−O, C−N stretching region (Fig. 3). To confirm the N-methylaminomethanol formation, we performed an isotopic substitution experiment using 15N methylamine, and compared these results with those obtained from our quantum calculation using the B3LYP 6-311G++(2d, 2p) basis set. The theoretical and experimental frequencies for 14N-methylaminomethanol are listed in Table 2 along with theoretical and experimental frequency shifts between 14N and 15N isotopologues. Although harmonic calculations overestimate frequencies corresponding to X-H stretching modes (Table 2), we observe a good agreement between the experimental and calculated frequencies of 14N-methylaminomethanol (Table 2, Fig. 3), especially at frequencies lower than 1600 cm-1. We also compared experimental frequency shifts between 14N and 15N isotopologues with theoretical values. Calculated frequency shifts are small (smaller than 15 cm-1). The largest calculated shift of 13 cm-1 is for the C−N stretching mode, which agrees well with the observed experimental shift of 11 cm-1 (Table 2). The same agreement is also observed for others modes. For example, the calculated isotopic shift for the NH stretching mode is 8 cm-1, while we experimentally observed 7 cm-1.
Experimental and theoretical frequencies (in cm-1) and integrated band strengths (cm molecule-1) of pure CH NHCH2OH and CH
 NHCH2OH.
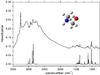 |
Fig. 3 FTIR spectrum of pure CH3NHCH2OH formed from the warming of an H2O/H2CO/CH3NH2 ice mixture compared with the corresponding B3LYP infrared spectrum. |
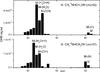 |
Fig. 4 Mass spectrum of CH3NHCH2OH 14N and 15N recorded at 210 K. |
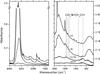 |
Fig. 5 FTIR spectra of (a) H2O/H2CO/CH3NH2 = 1/0.1/0.05 ice mixture deposited at 30 K and recorded at 30 K; (b) recorded at 125 K; (c) recorded at 185 K; (d) recorded at 200 K. |
The CH3NHCH2OH formation is also confirmed by mass spectrometry as shown in Fig. 4. A clear peak at m/z 61 is observed when the 14N-methylaminomethanol sublimates from the substrate around 210 K. This peak is assigned to the CH3NHCH2OH molecular ion and is labelled M in Fig. 4. In addition, the peak at m/z 43 (Fig. 4) corresponding to the loss of H2O (M-18) is consistent with a molecule-bearing OH group. The mass spectrum of the 15N isotopologue is similar, although most of the peaks are shifted forward by 1 mass unity due to the isotopic substitution (Fig. 4), which confirms the previous assignments. The ice composition we used to form and characterise the N-methylaminomethanol is not astrophysically relevant since we worked with an excess of methylamine to avoid the formaldehyde polymerisation. To check if the N-methylaminomethanol formation is still possible in a more realistic ice, we investigated the warming of an ice mixture containing H2O/H2CO/CH3NH2 = 1/0.1/0.05. Figure 5 shows the thermal evolution of this ice mixture. The infrared spectrum recorded at 30 K after deposition is dominated by the strong infrared band of water at 3200 cm-1, while the infrared features of formaldehyde and methylamine are weak due to their low abundances in the ice mixture (Fig. 5). The ice mixture was then warmed at 4 K min-1. At 125 K, both formaldehyde and methylamine have been consumed while the bands of N-methylaminomethanol are observed at 1481, 1454, 1423, 1388, 1208, 1143, 1064, 1032, and 1004 cm-1. The position of the bands slightly differs from their positions observed for the pure solid (Table 2) because of the large amount of water. Hydrogen interaction between water and the N-methylaminomethanol could be at the origin of these slight frequency shifts. At 185 K, while the water is sublimating from the substrate, we notice a decrease of the infrared features of the N-methylaminomethanol, indicating that a part of the product is driven away by the water desorption. This is confirmed by the infrared spectrum recorded at 200 K. At this temperature, only a trace of the N-methylaminomethanol remains on the substrate. This is an important result from an astrophysical point of view. Indeed, the formation of the N-methylaminomethanol, from the heating of a realistic ice analogue, is still possible and the majority of the thermal product is released in the gas phase during the water desorption, allowing its detection by radio astronomy.
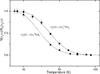 |
Fig. 6 Formaldehyde thermal evolution as a function of temperature in water ice containing CH3NH214N (triangle), and 15N (square) (H2O/CH3NH2/CH2O = 1/2/0.1). The rate coefficients are given in the form k = ν0exp( − E/RT), where T is the ice temperature (K), ν0 the pre-exponential factor (s-1), and E the activation energy (J mol-1). The corresponding rate coefficients are k14N = 1.5 ± 0.1 × 10⁻²exp( − 1100 ± 50/RT) and k15N = 2.6 ± 0.3 × 10⁻²exp( − 1800 ± 80/RT). |
3.2. Rate of CH3NHCH2OH formation
We measured the CH3NHCH2OH formation rate in a H2O/CH3NH2/H2CO ice mixture in an 1/2/0.1 concentration ratio. We chose to work with a methylamine excess to avoid any formaldehyde polymerisation and to ensure a first-order decay for the formaldehyde. In a first approximation we can state that the methylamine concentration in the ice is constant during the ice warming. The ice mixture was deposited at 19 K and then warmed at 4 K min-1. During the warming, we followed the evolution of the formaldehyde using its band located at 1715 cm-1 ( cm molecule-1). This thermal evolution is displayed in Fig. 6. Experimental data were fitted using Eq. (2). In this equation, T is the temperature (K), ν0 the pre-exponential factor (s-1), Ea the activation energy (kJ mol-1), and β the temperature ramp (K min-1). We integrated the formaldehyde variation over the time and then substituted the time by the temperature according to the relation T = T0+βt. We finally obtained a relation between the amount of formaldehyde as a function of temperature (Eq. (2)),
 ![Mathematical equation: \begin{equation} \label{eq2} \left\{\begin{array}{llll} \frac{\rm d[H_2CO]_{\it t}}{{\rm d}t}=-k_T\rm [H_2CO]_{\it t}\\ T=T_0 + \beta t ~~~{\rm and}~~~ k_T=\nu_0 {\rm e}^{-\frac{E_{\rm a}}{RT}} \\ \left[ {\rm H_2CO}\right]_T= \left[{\rm H_2CO}\right]_0 {\rm e}^{\frac{\nu_0 (T_0-T)}{\beta} {\rm e}^{-\frac{E_{\rm a}}{RT}}}.\\ \end{array} \right. \end{equation}](/articles/aa/full_html/2013/01/aa19974-12/aa19974-12-eq77.png) (2)The derivated activation energy of 1.1 ± .05 kJ mol-1 (i.e. 133 K) is lower than the one obtained for the aminomethanol (4.5 kJ mol-1 or 541 K) (Bossa et al. 2009b). This is not surprising since methylamine is a better nucleophile than ammonia. Moreover, a barrier this low is compatible with the low temperature observed in interstellar ices, meaning that the addition of methylamine on formaldehyde is likely in interstellar grains. We also investigated the influence of isotopic substitution on the reaction rate. We used the same experimental procedure as previously on an ice mixture containing H2O/CH
(2)The derivated activation energy of 1.1 ± .05 kJ mol-1 (i.e. 133 K) is lower than the one obtained for the aminomethanol (4.5 kJ mol-1 or 541 K) (Bossa et al. 2009b). This is not surprising since methylamine is a better nucleophile than ammonia. Moreover, a barrier this low is compatible with the low temperature observed in interstellar ices, meaning that the addition of methylamine on formaldehyde is likely in interstellar grains. We also investigated the influence of isotopic substitution on the reaction rate. We used the same experimental procedure as previously on an ice mixture containing H2O/CH NH2/CH2O in a 1/2/0.1 concentration ratio. This ice mixture was deposited at 19 K and then warmed at 4 K min-1 as for the 14N experiment. The corresponding thermal evolution is displayed in Fig. 6. The time evolution of formaldehyde was then fitted with Eq. (2). The derived activation energy is in this case, 1.8 ± .08 kJ mol-1 (i.e. 217 K). The isotopic substitution modifies the reaction rate (as seen in Fig. 6) and the activation barrier. This is consistent with a primary isotopic effect, since the bonds that are formed during the reaction involves the nitrogen atom. However, the difference between the measured barrier for the 14N and 15N is bigger than the value we would expect for nitrogen substitution. This could be due to the mechanism of N-methylaminomethanol formation in ice at low temperature. Indeed, the measured activation barriers are effective barriers that include diffusion processes of the reactants, nucleophilic addition (i.e. attack of the methylamine on the formaldehyde), and finally the hydrogen transfer from the nitrogen to the oxygen of the N-methylaminomethanol. All these processes could be sensitive to the isotopic substitution, leading to an isotopic kinetic effect stronger than it would appear in liquid phase at room temperature where diffusion and hydrogen transfers are not necessary the limiting rate of nucleophilic addition reaction.
3.3. Photolysis of CH3NHCH2OH
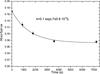 |
Fig. 7 Absorbance of CH3NHCH2OH as a function of UV irradiation time. Experimental data are fitted against a first-order decay. |
As already mentioned in the introduction, interstellar ices in a star-forming region or in pre-cometary ices are submitted to various physical processes such as UV irradiation. Therefore, we investigated the UV degradation of the N-methylaminomethanol. We first formed CH3NHCH2OH as described above. We then desorbed the starting materials (H2O, H2CO, and CH3NH2) at 180 K to obtain pure CH3NHCH2OH. We then irradiated it at 20 K with a UV hydrogen lamp and followed its photolysis by infrared spectroscopy as displayed in Fig. 7. The UV flux is estimated to be 2 × 10¹⁵ photons cm-2 s-1. After 120 min of UV irradiation, 60% of CH3NHCH2OH was consumed, as shown in Fig. 7, and its decay was fitted by a first-order kinetic rate. The corresponding kinetic constant is found to be around 7 ± 0.8 × 10⁻⁴ s-1. With our flux of photons, the photo-destruction cross-section can be estimated to be σphoto = 3 ± 0.4 × 10⁻¹⁹ photon-1 cm2. This photo-destruction cross-section refers at least to two different processes: photo-dissociation (i.e. bond-breaking) and photo-desorption (Fayolle et al. 2011, and references therein). However, in our vacuum condition, it is not possible to separate those two processes.
In addition to the infrared signatures of CH3NHCH2OH (see Fig. 8), the irradiated sample displays through new bands at 1670 cm-1 the formation of an amide, which could be the N-methylformamide CH3NHCHO (Shin et al. 2006), as shown in Fig. 8. After irradiating N-methylaminomethanol at 10 K, the sample was warmed to 250 K and the desorption of the photo-product was monitored by mass spectrometry (Fig. 9). At 220 K, a clear peak is observed at m/z 59, corresponding to the molecular ion of N-methylformamide. This peak is not present when CH3NHCH2OH is not irradiated. It has been noted that UV irradiation induces a modification of temperature desorption through changes in the ice structure induced by photons (Fig. 9). The N-methylformamide formation from N-methylaminomethanol may be the result of a dehydrogenation process as follows:
 The same dehydrogenation mechanism has been observed in the UV photolysis of methanol and aminomethanol that give formaldehyde and formamide, respectively (Bossa et al. 2009b; Öberg et al. 2009). The direct production of N-methylformamide from the photolysis of our product is an additional evidence of the N-methylaminomethanol formation.
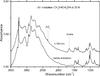 |
Fig. 8 Infrared spectra of the UV photolysis of pure CH3NHCH2OH 14N at 20 K. |
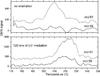 |
Fig. 9 Temperature-programmed desorption of pure N-methylaminomethanol with and without UV irradiation. The m/z 61 signal refers to the N-methylaminomethanol while the m/z 59 signal refers to the photo-product: the N-methylformamide. |
4. Astrophysical implications
Parameters for thermal reactions, desorptions, and photo-destruction.
We experimentally demonstrated that formaldehyde and methylamine quickly react in laboratory conditions to form the N-methylaminomethanol. To know if this reaction could be likely in more astrophysical conditions in terms of temperature, time scale, abundances, and UV flux, we simulated its formation using a reduced chemical reaction network (Eq. (3)),
![Mathematical equation: \begin{equation} \label{model} \left\{\begin{array}{llll} \frac{{\rm d[H_2CO}]}{{\rm d}t}=-k_1[{\rm H_2CO}]_t[{\rm NH_3}]_t-k_2[{\rm H_2CO}]_t[{\rm CH_3NH_2}]_t\\\qquad\qquad -k_3[{\rm H_2CO}]_t-k_4[{\rm H_2CO}]_t\\ % \frac{{\rm d[ NH_3}]_t}{{\rm d}t}=-k_1[{\rm H_2CO}]_t[{\rm NH_3}]_t-k_5[{\rm NH_3}]_t-k_6[{\rm NH_3}]_t\\ % \frac{{\rm d[CH_3NH_2}]_t}{{\rm d}t}=-k_2[{\rm H_2CO}]_t[{\rm CH_3NH_2}]_t\\\qquad\qquad\quad -k_7[{\rm CH_3NH_2}]_t-k_8[{\rm CH_3NH_2}]_t\\ % \\ \end{array} \right. \end{equation}](/articles/aa/full_html/2013/01/aa19974-12/aa19974-12-eq110.png) (3)The abundance of CH3NHCH2OH was calculated using a numerical resolution of a system of first-order ordinary differential equations that model the formation and destruction of each species, the water abundance being kept constant (Eq. (3)). Terms in these equations can be sorted into three different classes: thermal formation, thermal desorption, and photo-destruction. The photo-destruction term includes two different processes: photo-dissociation and photo-desorption. However, due to our experimental setup, we cannot separate those two phenomena. The reduced chemical reaction network, parameters, and the ordinary differential equation system are shown in Eq. (3), and Table 3. For two-body thermal reactions (k1, k2, and k13) and thermal desorptions (k4, k5, k8, k9, k11), the rate coefficients are given in the form k = ν0exp( − E/T), where T is the ice temperature, ν0 the pre-exponential factor, and E the energy (activation or desorption). Two sets of simulation were carried out. The first one neglects diffusion processes, while the second one includes them. In the latter case, we substituted the pre-exponential factor by a new parameter (ν0(dif)), which takes into account the diffusion processes according to the method developed by Hasegawa et al. (1992) (see Table 3). Thus for a two-body thermal reaction including the diffusion between the i and j species, the rate coefficients are given in the form k = ν0(dif)exp(− E/T). Photo-dissociation rates (k3, k6, k7, k10, k12, k14) are written as k = σf, where σ represents the photo-dissociation cross-section for a given species, and f the ultraviolet radiation field depending on the astrophysical environment (Woodall et al. 2007). Kinetic data were used as well as the photo-dissociation cross-section obtained in this work (σphoto (CH3NHCH2OH) = 3 ± 0.4 × 10⁻¹⁹ photon-1 cm2) to estimate kinetic rates of the formation (k1) and photo-dissociation reactions (k12) of CH3NHCH2OH. The photo-dissociation rates of CO2, H2CO, NH3, and NH2CH2OH were also taken into account using the kinetic rates given in the literature. We also included the desorption rates for all reactants and all products. We included thermal reactions that could compete with the N-methylaminomethanol formation: methylcarbamate (Eq. (4)) and aminomethanol formations (Eq. (5)) (Bossa et al. 2009a,b). All thermal reactions, photo-dissociation, and desorption rates are given in Table 3.
(3)The abundance of CH3NHCH2OH was calculated using a numerical resolution of a system of first-order ordinary differential equations that model the formation and destruction of each species, the water abundance being kept constant (Eq. (3)). Terms in these equations can be sorted into three different classes: thermal formation, thermal desorption, and photo-destruction. The photo-destruction term includes two different processes: photo-dissociation and photo-desorption. However, due to our experimental setup, we cannot separate those two phenomena. The reduced chemical reaction network, parameters, and the ordinary differential equation system are shown in Eq. (3), and Table 3. For two-body thermal reactions (k1, k2, and k13) and thermal desorptions (k4, k5, k8, k9, k11), the rate coefficients are given in the form k = ν0exp( − E/T), where T is the ice temperature, ν0 the pre-exponential factor, and E the energy (activation or desorption). Two sets of simulation were carried out. The first one neglects diffusion processes, while the second one includes them. In the latter case, we substituted the pre-exponential factor by a new parameter (ν0(dif)), which takes into account the diffusion processes according to the method developed by Hasegawa et al. (1992) (see Table 3). Thus for a two-body thermal reaction including the diffusion between the i and j species, the rate coefficients are given in the form k = ν0(dif)exp(− E/T). Photo-dissociation rates (k3, k6, k7, k10, k12, k14) are written as k = σf, where σ represents the photo-dissociation cross-section for a given species, and f the ultraviolet radiation field depending on the astrophysical environment (Woodall et al. 2007). Kinetic data were used as well as the photo-dissociation cross-section obtained in this work (σphoto (CH3NHCH2OH) = 3 ± 0.4 × 10⁻¹⁹ photon-1 cm2) to estimate kinetic rates of the formation (k1) and photo-dissociation reactions (k12) of CH3NHCH2OH. The photo-dissociation rates of CO2, H2CO, NH3, and NH2CH2OH were also taken into account using the kinetic rates given in the literature. We also included the desorption rates for all reactants and all products. We included thermal reactions that could compete with the N-methylaminomethanol formation: methylcarbamate (Eq. (4)) and aminomethanol formations (Eq. (5)) (Bossa et al. 2009a,b). All thermal reactions, photo-dissociation, and desorption rates are given in Table 3. ![Mathematical equation: \begin{eqnarray} \label{eq3} && \rm 2CH_3NH_2+ CO_2 \xrightarrow[]{\Delta} CH_3NH_3^+CH_3NHCOO^- \\ \label{eq4} && \rm H_2CO + NH_3 \xrightarrow[]{\Delta} NH_2CH_2OH. \end{eqnarray}](/articles/aa/full_html/2013/01/aa19974-12/aa19974-12-eq128.png) Other reactions that can occur in the ice between CH3NH2 and acids such as HNCO, HCOOH, and HCN are neglected in our simulation since they are supposed to be in lower abundances than NH3 and CO2. The initial ice composition H2O/NH3/CH3NH2/H2CO/CO2 = 100/10/1/5/7 was chosen according to the average abundances observed in interstellar ices. The temperature and the UV flux were kept constant at 10 K and 103 photons cm-2 s-1 during the simulation. Simulated abundances of reactants (namely NH3, H2CO, CH3NH2, and CO2) are displayed in Fig. 10, while the abundances of the related products are displayed in Fig. 11. At 10 K, without taking into account the diffusions processes, the abundances of NH3, and CO2 are not affected by thermal activation (Fig. 10). The slow decrease observed for ammonia after 105 years is only caused by photo-degradation process. In contrast, in the same conditions, formaldehyde and methylamine quickly react in less than one year (see Fig. 10 left panel) to form the N-methylaminomethanol (see Fig. 11). The maximum concentration (1% with respect to water) is reached after one year and slowly decreases after 106 years through UV degradation. Finally it is fully photolysed, forming the N-methylformamide after 108 years (Fig. 11 left panel). In this case methylamine is fully consumed (Fig. 10).
Other reactions that can occur in the ice between CH3NH2 and acids such as HNCO, HCOOH, and HCN are neglected in our simulation since they are supposed to be in lower abundances than NH3 and CO2. The initial ice composition H2O/NH3/CH3NH2/H2CO/CO2 = 100/10/1/5/7 was chosen according to the average abundances observed in interstellar ices. The temperature and the UV flux were kept constant at 10 K and 103 photons cm-2 s-1 during the simulation. Simulated abundances of reactants (namely NH3, H2CO, CH3NH2, and CO2) are displayed in Fig. 10, while the abundances of the related products are displayed in Fig. 11. At 10 K, without taking into account the diffusions processes, the abundances of NH3, and CO2 are not affected by thermal activation (Fig. 10). The slow decrease observed for ammonia after 105 years is only caused by photo-degradation process. In contrast, in the same conditions, formaldehyde and methylamine quickly react in less than one year (see Fig. 10 left panel) to form the N-methylaminomethanol (see Fig. 11). The maximum concentration (1% with respect to water) is reached after one year and slowly decreases after 106 years through UV degradation. Finally it is fully photolysed, forming the N-methylformamide after 108 years (Fig. 11 left panel). In this case methylamine is fully consumed (Fig. 10).
In interstellar ices, molecules are diluted in water, and diffusion of molecules is an important process that will slow down two-body thermal reactions since molecules have to diffuse before reacting. Therefore, we included a diffusion parameter (Hasegawa et al. 1992) in our simulations by changing the pre-exponential factor (ν0) to a new constant parameter ν0(dif) = 3.3 × 10⁻⁹ s-1. Results are shown in the right panel of Figs. 10 and 11. In this case formaldehyde and methylamine still react but at higher temperature (30 K) which can be observed on astrophysical time scales. The methylamine is fully consumed and is not observed after 105 years, meaning that in the presence of formaldehyde, methylamine is not likely to be detected in warmed objects. As previously, the N-methylaminomethanol thermally formed was photolysed and fully disappears after 108 years, giving the corresponding amide (CH3NHCHO).
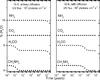 |
Fig. 10 H2CO (full triangle), NH3 (full circle), CO2 (full diamond), CH3NH2 (full square) simulated abundances in ice as a function of time at 10 K and in a UV flux of 103 photons cm-2 s-1 without taking into account diffusion processes (left panel), and at 30 K in a UV flux of 103 photons cm-2 s-1 with diffusion processes included (right panel). |
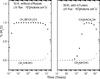 |
Fig. 11 N-methylaminomethanol (CH3NHCH2OH) (full square) and N-methylformamide (CH3NHCHO) (open square) simulated abundances in ice as a function of time at 10 K and in a UV flux of 103 photons cm-2 s-1 without taking into account diffusion processes (left panel), and at 30 K in a UV flux of 103 photons cm-2 s-1 with diffusion processes included (right panel). |
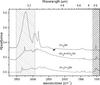 |
Fig. 12 Infrared spectra of CH3OH, CH3NHCH2OH, NH2CH2OH recorded at 10 K. The shaded areas indicate the regions of the strong interstellar H2O and silicate absorptions. |
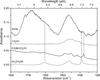 |
Fig. 13 Comparison between W 33A and laboratory spectra of CH3OH, CH3NHCH2OH, and NH2CH2OH in the 5.5−7.7 μm range. |
According to our simulations, the formation of N-methylaminomethanol from the reaction between formaldehyde and methylamine seems to be possible in interstellar ices when they are gently warmed, as occurs in YSOs, or in comets. However, solid-state identification in interstellar ices from infrared spectra is far from obvious, since some regions are blended by the strong infrared features of both water and silicate (see shaded areas in Fig. 12), and also by the low abundance of these compounds. Aminoalcohols have absorption bands in a clear region in the 5−7 μm wavelength range (Fig. 12), and thus could contribute to the 5−7 μm complex, and more specially to the 6, 6.85 and 7.41 μm bands that are observed in many astronomical infrared spectra such as W 33A (Fig. 13). W 33A is a high-mass YSO with particularly rich solid-state molecular features (Dartois et al. 1999; Gibb et al. 2000; Keane et al. 2001), with abundant quantities of methanol, which is a signature of an advanced solid-state chemistry. In the bottom panel of Fig. 13 we display the laboratory infrared spectrum of NH2CH2OH in the 5−8 μm range. NH2CH2OH has been proposed to be a possible carrier to the 6 μm and 6.85 μm bands. In particular its 6.15 μm band helps filling in the low-energy half of the 6 μm band (Bossa et al. 2009b). The 7 μm to 7.5 μm regions are also better explained. The same arguments can be used for the N-methylaminomethanol. The shape of the CH3NHCH2OH 7 μm band is similar to the CH3OH band, but its 7.20 μm feature reproduces the 7.24 μm feature in the astronomical spectrum much better (Fig. 13). Although it is not possible to extract reliable abundances for N-methylaminomethanol by deconvolving the astronomical infrared spectra with so many carriers, we can propose that aminoalcohols must be accounted as a carrier of the 5−8 μm complex, and that their presence is the signature of a thermal processing of the ice. Furthermore, as many other complex molecules, their detection after sublimation in the hot core region by radio astronomy should be possible. The non-detection so far of these compounds in the gas phase comes from the lack of rotational spectra for these molecules. From an astrobiological point of view, aminoalcohols are interesting molecules because they are considered as amino acid precursors in the Strecker synthesis (Bossa et al. 2009b; Danger et al. 2011; Duvernay et al. 2010; Rimola et al. 2010; Vinogradoff et al. 2011). In our case the N-methylaminomethanol will form through the Strecker synthesis the corresponding amino acid, the sarcosine (Eq. (6)), which has been detected in meteorites (Burton et al. 2012),
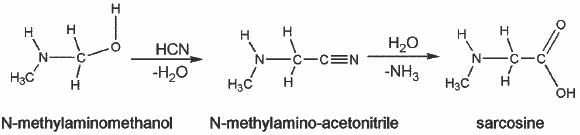 (6)
Another interesting aspect that has been underlined in this work is the possibility to induce isotopic fractionation through thermal reaction in ice as is observed in some astrophysical objects. Indeed, some meteoritic materials and interstellar dust particles possess enhancements and anomalies in their
(6)
Another interesting aspect that has been underlined in this work is the possibility to induce isotopic fractionation through thermal reaction in ice as is observed in some astrophysical objects. Indeed, some meteoritic materials and interstellar dust particles possess enhancements and anomalies in their  ratios. The variability of the
  ratio in these materials suggest, as with deuterium, a formation induced by low-temperature interstellar chemistry (Charnley & Rodgers 2002; Kerridge et al. 1987; Messenger & Walker 1997). To estimate the possible isotopic fractionation between the 14N methylamine and the corresponding 15N isotopologue in interstellar ices, we calculated with a reduced kinetic model (Eq. (7)) the isotopic ratio at 30 K. We chose for the initial conditions an ice mixture of H2O/CH2O/CH314NH2/CH315NH2 in a 100/5/1/2.8 × 10-3 concentration ratio. The
  isotopic ratio is the value reported for ammonia in dense molecular clouds (Pizzarello & Williams 2012). The simulation is displayed in Fig. 14. At 30 K, the isotopic ratio for methylamine in ice exponentially increases and reaches the value of 9 × 10⁻¹ after 0.5 × 10⁶ years. This result clearly shows that isotopic fractionation at low temperature, induced by thermal reaction, is efficient and has to be taken into account in more sophisticated astrophysical models. Moreover, the 15N enrichment observed in this simulation is consistent with the increase observed in the 15N/14N ratio between interstellar grains and cometary and meteoritic grains,
 ![Mathematical equation: \begin{eqnarray} \label{iso} \left\{\begin{array}{llll} \frac{\rm d[CH_3^{~14}NH_2]_{\it t}}{{\rm d}t}=-k_{^{14}\rm N}\rm [H_2CO]_{\it t}[CH_3^{~14}NH_2]_t\\[2mm] \frac{\rm d[CH_3^{~15}NH_2]_{\it t}}{{\rm d}t}=-k_{^{15}\rm N}\rm [H_2CO]_t[CH_3^{~15}NH_2]_{\it t}\\[2mm] k_{^{14}\rm N}=1.5\times 10^{-2}\times {\rm e}^{-\frac{-1100}{RT}}\\[2mm] k_{^{15}\rm N}=2.6\times 10^{-2}\times {\rm e}^{-\frac{-1800}{RT}}. \\ \end{array} \right. \end{eqnarray}](/articles/aa/full_html/2013/01/aa19974-12/aa19974-12-eq148.png) (7)
(7)
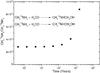 |
Fig. 14 Evolution of the |

5. Conclusion
We have investigated the thermal formation of N-methylaminomethanol (CH3NHCH2OH) formation in water ices from formaldehyde (H2CO) and 14N, or 15N methylamine (CH314NH2, and CH315NH2). We showed that the N-methylaminomethanol formation in interstellar or cometary ices is likely and proposed this molecule as a possible candidate for some infrared features observed in W 33A. In addition, the kinetics study performed with 15N methylamine shows that these thermal reactions with a low barrier (1.1 ± 0.05 kJ mol-1) are efficient in producing 15N/14N isotopic fractionation. We also investigated the N-methylaminomethanol stability in UV radiation and showed that this molecule leads to the formation of the N-methylformamide. This work provides additional evidences for thermal reactions in interstellar ices as a source of molecular complexity in the ISM. N-methylaminomethanol should be detected in the gas phase when the ices have sublimated, for instance in a hot core region.
Acknowledgments
This work has been founded by the French national program Physique Chimie du Milieu Interstellaire (PCMI), the Centre National des Études Spatiales (CNES), and the Provence-Alpes-Côte d’Azur region (PACA).
References
- Boogert, A., Pontoppidan, K., Knez, C., et al. 2008, ApJ, 678, 985 [NASA ADS] [CrossRef] [Google Scholar]
- Bossa, J., Duvernay, F., Theulé, P., et al. 2009a, A&A, 506, 601 [NASA ADS] [CrossRef] [EDP Sciences] [Google Scholar]
- Bossa, J., Theule, P., Duvernay, F., & Chiavassa, T. 2009b, ApJ, 707, 1524 [NASA ADS] [CrossRef] [Google Scholar]
- Burton, A., Stern, J., Elsila, J., Glavin, D., & Dworkin, J. 2012, Chem. Soc. Rev., 41, 5459 [CrossRef] [PubMed] [Google Scholar]
- Charnley, S., & Rodgers, S. 2002, ApJ, 569, L133 [NASA ADS] [CrossRef] [Google Scholar]
- Chen, L., & Woon, D. 2011, J. Phys. Chem. A, 115, 5166 [CrossRef] [Google Scholar]
- Cottin, H., Moore, M., & Bénilan, Y. 2003, ApJ, 590, 874 [NASA ADS] [CrossRef] [Google Scholar]
- Danger, G., Borget, F., Chomat, M., et al. 2011, A&A, 535, A47 [NASA ADS] [CrossRef] [EDP Sciences] [Google Scholar]
- Dartois, E., Schutte, W., Geballe, T., et al. 1999, A&A, 342, L32 [NASA ADS] [Google Scholar]
- Duvernay, F., Chiavassa, T., Borget, F., & Aycard, J. 2004, Chem. Phys., 298, 241 [NASA ADS] [CrossRef] [Google Scholar]
- Duvernay, F., Chatron-Michaud, P., Borget, F., Birney, D. M., & Chiavassa, T. 2007, Phys. Chem. Chem. Phys., 9, 1099 [CrossRef] [PubMed] [Google Scholar]
- Duvernay, F., Dufauret, V., Danger, G., et al. 2010, A&A, 523, A79 [NASA ADS] [CrossRef] [EDP Sciences] [Google Scholar]
- Elsila, J., Glavin, D., & Dworkin, J. 2009, Meteor. Planet. Sci., 44, 1323 [NASA ADS] [CrossRef] [Google Scholar]
- Fayolle, E., Bertin, M., Romanzin, C., et al. 2011, ApJ, 739, L36 [NASA ADS] [CrossRef] [Google Scholar]
- Fourikis, N., Takagi, K., & Morimoto, M. 1974, ApJ, 191, L139 [NASA ADS] [CrossRef] [Google Scholar]
- Frisch, M., Trucks, G., Schlegel, H., et al. 1998, Gaussian 98, revision A. 7, Gaussian, Vol. 25 [Google Scholar]
- Gardner, E., & McNesby, J. 1982, J. Phys. Chem., 86, 2646 [CrossRef] [Google Scholar]
- Gibb, E., Whittet, D., Schutte, W., et al. 2000, ApJ, 536, 347 [NASA ADS] [CrossRef] [Google Scholar]
- Godfrey, R., Brown, R., Robinson, B., & Sinclair, M. 1973, Discovery of interstellar methanimine (formaldimine)., Tech. rep., Monash Univ., Melbourne [Google Scholar]
- Hasegawa, T., Herbst, E., & Leung, C. 1992, ApJS, 82, 167 [NASA ADS] [CrossRef] [Google Scholar]
- Herbst, E. 1985, ApJ, 292, 484 [NASA ADS] [CrossRef] [Google Scholar]
- Hiraoka, K., Ohashi, N., Kihara, Y., et al. 1994, Chem. Phys. Lett., 229, 408 [NASA ADS] [CrossRef] [Google Scholar]
- Hiraoka, K., Sato, T., Sato, S., et al. 2002, ApJ, 577, 265 [NASA ADS] [CrossRef] [Google Scholar]
- Holtom, P., Bennett, C., Osamura, Y., Mason, N., & Kaiser, R. 2005, ApJ, 626, 940 [NASA ADS] [CrossRef] [Google Scholar]
- Keane, J., Tielens, A., Boogert, A., Schutte, W., & Whittet, D. 2001, A&A, 376, 254 [NASA ADS] [CrossRef] [EDP Sciences] [Google Scholar]
- Kerridge, J., Chang, S., & Shipp, R. 1987, Geochim. Cosmochim. Acta, 51, 2527 [NASA ADS] [CrossRef] [PubMed] [Google Scholar]
- Lee, C., Yang, W., & Parr, R. 1988, Phys. Rev. B, 37, 785 [Google Scholar]
- Messenger, S., & Walker, R. 1997, in AIP Conf. Proc., 402, 545 [Google Scholar]
- Öberg, K., Garrod, R., VANDishoeck, E., & Linnartz, H. 2009, A&A, 504, 891 [NASA ADS] [CrossRef] [EDP Sciences] [Google Scholar]
- Ogura, K., Migita, C., & Yamada, T. 1989, J. Photochem. Photobiol. A: Chem., 49, 53 [CrossRef] [Google Scholar]
- Pizzarello, S., & Williams, L. 2012, ApJ, 749, 161 [NASA ADS] [CrossRef] [Google Scholar]
- Rimola, A., Sodupe, M., & Ugliengo, P. 2010, Phys. Chem. Chem. Phys., 12, 5285 [CrossRef] [PubMed] [Google Scholar]
- Schutte, W., Allamandola, L., & Sandford, S. 1993, Icarus, 104, 118 [NASA ADS] [CrossRef] [PubMed] [Google Scholar]
- Shin, S., Kurawaki, A., Hamada, Y., et al. 2006, J. Mol. Struct., 791, 30 [NASA ADS] [CrossRef] [Google Scholar]
- Theule, P., Borget, F., Mispelaer, F., et al. 2011, A&A, 534, A64 [NASA ADS] [CrossRef] [EDP Sciences] [Google Scholar]
- Vinogradoff, V., Duvernay, F., Danger, G., Theulé, P., & Chiavassa, T. 2011, A&A, 530, A128 [NASA ADS] [CrossRef] [EDP Sciences] [Google Scholar]
- Watanabe, N., Nagaoka, A., Shiraki, T., & Kouchi, A. 2004, ApJ, 616, 638 [NASA ADS] [CrossRef] [Google Scholar]
- Woodall, J., Agúndez, M., Markwick-Kemper, A., & Millar, T. 2007, A&A, 466, 1197 [NASA ADS] [CrossRef] [EDP Sciences] [Google Scholar]
All Tables
Infrared absorption bands and vibrational assignments of CH3NH2 and H2CO in pure solids and in a water ice environment at 20 K.
Experimental and theoretical frequencies (in cm-1) and integrated band strengths (cm molecule-1) of pure CHNHCH2OH and CHNHCH2OH.
All Figures
|
Fig. 1 FTIR spectrum of (a) H2O/H2CO/CH3NH2 = 1/0.1/2 ice mixture deposited at 30 K; (b) pure H2O ice deposited at 30 K; (c) pure H2CO ice deposited at 30 K; (d) pure CH3NH2 deposited at 20 K. |
| In the text | |
|
Fig. 2 FTIR spectra of (a) H2O/H2CO/CH3NH2 = 1/0.1/2 ice mixture deposited at 30 K and recorded at 30 K; (b) recorded at 70 K; (c) recorded at 190 K; (d) pure aminomethanol (NH2CH2OH) recorded at 190 K. |
| In the text | |
|
Fig. 3 FTIR spectrum of pure CH3NHCH2OH formed from the warming of an H2O/H2CO/CH3NH2 ice mixture compared with the corresponding B3LYP infrared spectrum. |
| In the text | |
|
Fig. 4 Mass spectrum of CH3NHCH2OH 14N and 15N recorded at 210 K. |
| In the text | |
|
Fig. 5 FTIR spectra of (a) H2O/H2CO/CH3NH2 = 1/0.1/0.05 ice mixture deposited at 30 K and recorded at 30 K; (b) recorded at 125 K; (c) recorded at 185 K; (d) recorded at 200 K. |
| In the text | |
|
Fig. 6 Formaldehyde thermal evolution as a function of temperature in water ice containing CH3NH214N (triangle), and 15N (square) (H2O/CH3NH2/CH2O = 1/2/0.1). The rate coefficients are given in the form k = ν0exp( − E/RT), where T is the ice temperature (K), ν0 the pre-exponential factor (s-1), and E the activation energy (J mol-1). The corresponding rate coefficients are k14N = 1.5 ± 0.1 × 10⁻²exp( − 1100 ± 50/RT) and k15N = 2.6 ± 0.3 × 10⁻²exp( − 1800 ± 80/RT). |
| In the text | |
|
Fig. 7 Absorbance of CH3NHCH2OH as a function of UV irradiation time. Experimental data are fitted against a first-order decay. |
| In the text | |
|
Fig. 8 Infrared spectra of the UV photolysis of pure CH3NHCH2OH 14N at 20 K. |
| In the text | |
|
Fig. 9 Temperature-programmed desorption of pure N-methylaminomethanol with and without UV irradiation. The m/z 61 signal refers to the N-methylaminomethanol while the m/z 59 signal refers to the photo-product: the N-methylformamide. |
| In the text | |
|
Fig. 10 H2CO (full triangle), NH3 (full circle), CO2 (full diamond), CH3NH2 (full square) simulated abundances in ice as a function of time at 10 K and in a UV flux of 103 photons cm-2 s-1 without taking into account diffusion processes (left panel), and at 30 K in a UV flux of 103 photons cm-2 s-1 with diffusion processes included (right panel). |
| In the text | |
|
Fig. 11 N-methylaminomethanol (CH3NHCH2OH) (full square) and N-methylformamide (CH3NHCHO) (open square) simulated abundances in ice as a function of time at 10 K and in a UV flux of 103 photons cm-2 s-1 without taking into account diffusion processes (left panel), and at 30 K in a UV flux of 103 photons cm-2 s-1 with diffusion processes included (right panel). |
| In the text | |
|
Fig. 12 Infrared spectra of CH3OH, CH3NHCH2OH, NH2CH2OH recorded at 10 K. The shaded areas indicate the regions of the strong interstellar H2O and silicate absorptions. |
| In the text | |
|
Fig. 13 Comparison between W 33A and laboratory spectra of CH3OH, CH3NHCH2OH, and NH2CH2OH in the 5.5−7.7 μm range. |
| In the text | |
|
Fig. 14 Evolution of the |
| In the text | |
Current usage metrics show cumulative count of Article Views (full-text article views including HTML views, PDF and ePub downloads, according to the available data) and Abstracts Views on Vision4Press platform.
Data correspond to usage on the plateform after 2015. The current usage metrics is available 48-96 hours after online publication and is updated daily on week days.
Initial download of the metrics may take a while.