Fig. 18
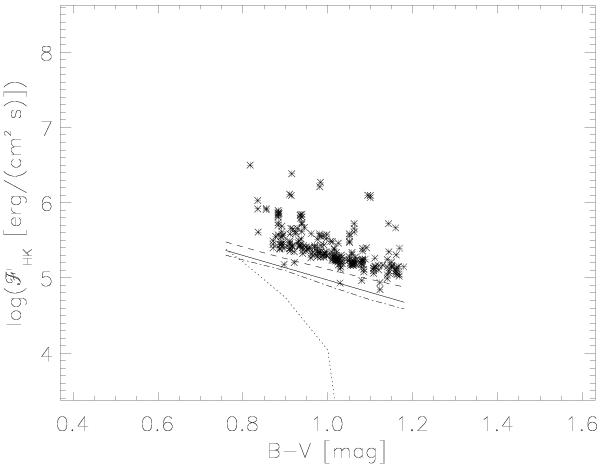
ℱ′HK of selected giant stars in the range 0.76 ≤ B − V < 1.18, the lower envelope is labelled with a solid line. The dashed line shows the basal flux from Strassmeier et al. (1994) (multiplied by the factor 2.5) directly, the dash-dotted (Rutten 1984) and dotted lines (Rutten et al. 1991) show the basal fluxes one would obtain, if the photospheric contributions are subtracted from the minimal fluxes determined by Rutten in the cited papers.
Current usage metrics show cumulative count of Article Views (full-text article views including HTML views, PDF and ePub downloads, according to the available data) and Abstracts Views on Vision4Press platform.
Data correspond to usage on the plateform after 2015. The current usage metrics is available 48-96 hours after online publication and is updated daily on week days.
Initial download of the metrics may take a while.