Free Access
Fig. 10
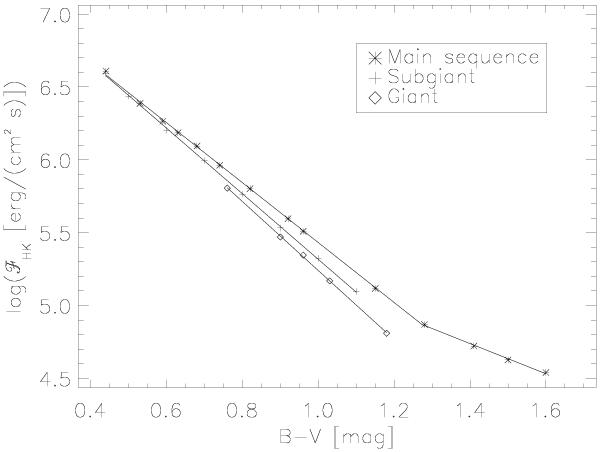
log ℱHK, phot of the Ca ii H+K lines calculated from the synthetic spectra vs. the colour index B − V for main sequence, sub giant and giant stars; the solid lines indicate the derived photospheric flux relations.
Current usage metrics show cumulative count of Article Views (full-text article views including HTML views, PDF and ePub downloads, according to the available data) and Abstracts Views on Vision4Press platform.
Data correspond to usage on the plateform after 2015. The current usage metrics is available 48-96 hours after online publication and is updated daily on week days.
Initial download of the metrics may take a while.