Fig. 3
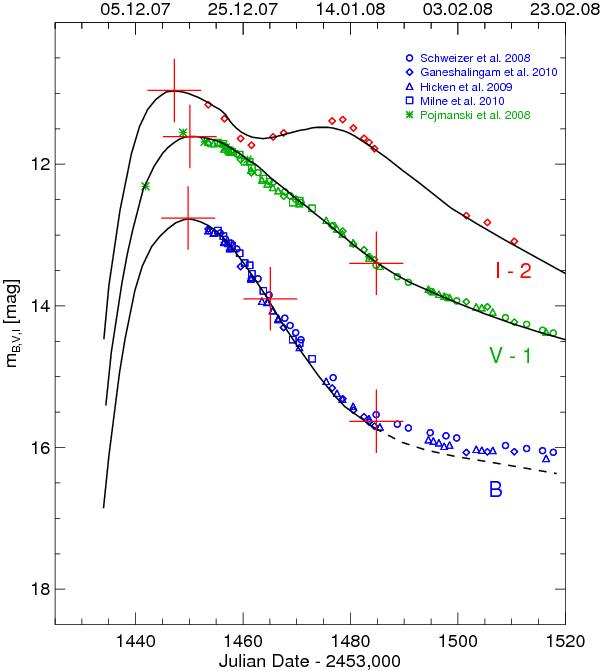
Light curve of SN Ia 2007sr in NGC 4038 in B (blue), V (green), and I (red) from different sources. The full lines are the light curves of SN 2011fe (Fig. 2) which has closely the same decline rate of Δm15 = 1.10; the poorly fitting tail of the B light curve is shown as a dashed line. The maximum epochs and those 15 and 35 days after B maximum are marked. The light curves in V and I are shifted by − 1 and − 2mag, respectively.
Current usage metrics show cumulative count of Article Views (full-text article views including HTML views, PDF and ePub downloads, according to the available data) and Abstracts Views on Vision4Press platform.
Data correspond to usage on the plateform after 2015. The current usage metrics is available 48-96 hours after online publication and is updated daily on week days.
Initial download of the metrics may take a while.