Fig. 2
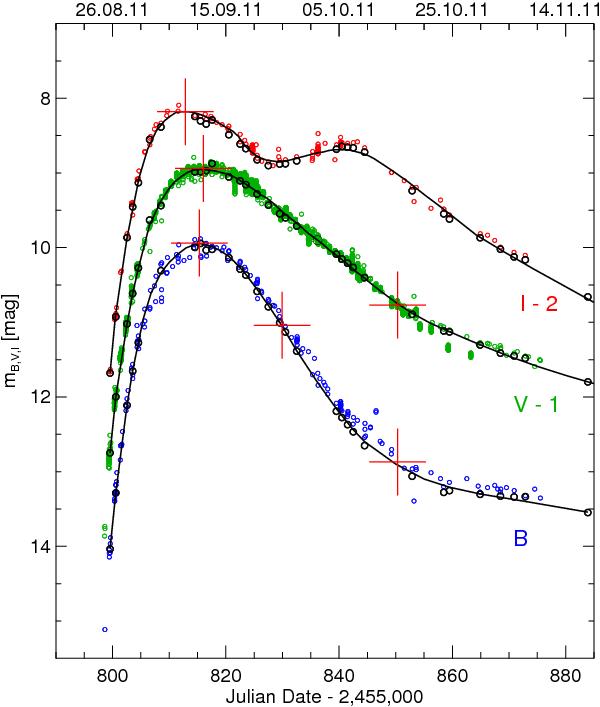
Light curve of SN Ia 2011fe in M101 in B (blue), V (green), and I (red) from AAVSO data (small open dots) and Richmond & Smith (2012) (large open dots). The well fitting, mean standard light curves in B and V of SNe Ia with Δm15 = 1.1 are overplotted; they are taken from Leibundgut (1988); in I the light curve of SN 1992al (Hamuy et al. 1996) is shown for comparison (for details see text). The maximum epochs and those 15 and 35 days after B maximum are marked. The light curves in V and I are shifted by −1 and −2 mag, respectively.
Current usage metrics show cumulative count of Article Views (full-text article views including HTML views, PDF and ePub downloads, according to the available data) and Abstracts Views on Vision4Press platform.
Data correspond to usage on the plateform after 2015. The current usage metrics is available 48-96 hours after online publication and is updated daily on week days.
Initial download of the metrics may take a while.