Fig. 8
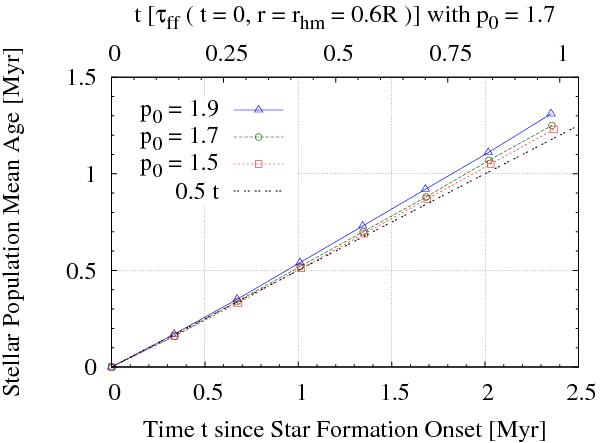
Relation between the time t elapsed since the onset of star formation in the simulations and the mean age of the stellar component. Owing to the ongoing gas depletion and the star formation slow down that it induces, the mean age is slightly older than half the simulation time span. The bottom x-axis shows the physical time (i.e. time in units of Myr) while the top x-axis shows time in units of the initial local free-fall time at the clump half-mass radius, τff(t = 0,rhm) when p0 = 1.7.
Current usage metrics show cumulative count of Article Views (full-text article views including HTML views, PDF and ePub downloads, according to the available data) and Abstracts Views on Vision4Press platform.
Data correspond to usage on the plateform after 2015. The current usage metrics is available 48-96 hours after online publication and is updated daily on week days.
Initial download of the metrics may take a while.