Fig. 7
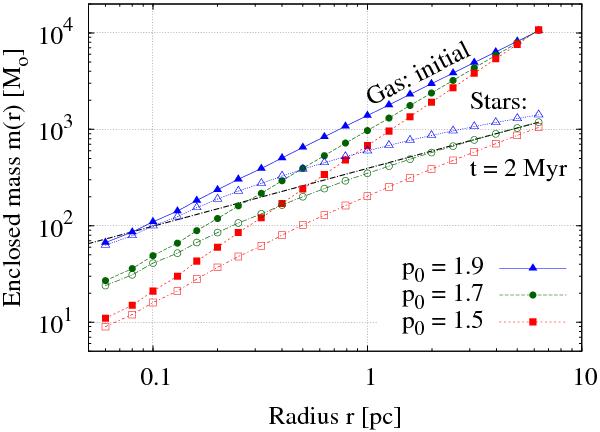
Cumulative mass m(r) vs. the three-dimensional radius r for the gas initially (plain symbols) and the stars at t = 2 Myr (open symbols) with density indices p0 quoted in the key. For a power-law density profile of index p0 (Eq. (1)), the slope of the mass distribution in the r − m(r) space is 3 − p0 (Eq. (21)). The steeper density profiles of the stellar component thus lead to r − m(r) relations shallower than their initial gas analogs (i.e. 3 − q vs. 3 − p0). Note that the slope of the stellar tracks get steeper towards the clump centre due to the shallower stellar density profiles there. The dash-dotted symbol-free line has a slope of 0.5, as expected for the r − m(r) relation of the stellar component in the low-density regime when p0 = 1.7, i.e. 3 − q ≃ 3−3p0/2 = 0.5. While it indeed fits the model with p0 = 1.7 well in the clump ’s outer regions (green open symbols; r ≳ 1 pc), the deviation increases towards the clump centre as the stellar density profile gets shallower than q = 3p0/2 (see middle panel of Fig. 1).
Current usage metrics show cumulative count of Article Views (full-text article views including HTML views, PDF and ePub downloads, according to the available data) and Abstracts Views on Vision4Press platform.
Data correspond to usage on the plateform after 2015. The current usage metrics is available 48-96 hours after online publication and is updated daily on week days.
Initial download of the metrics may take a while.