Fig. 6
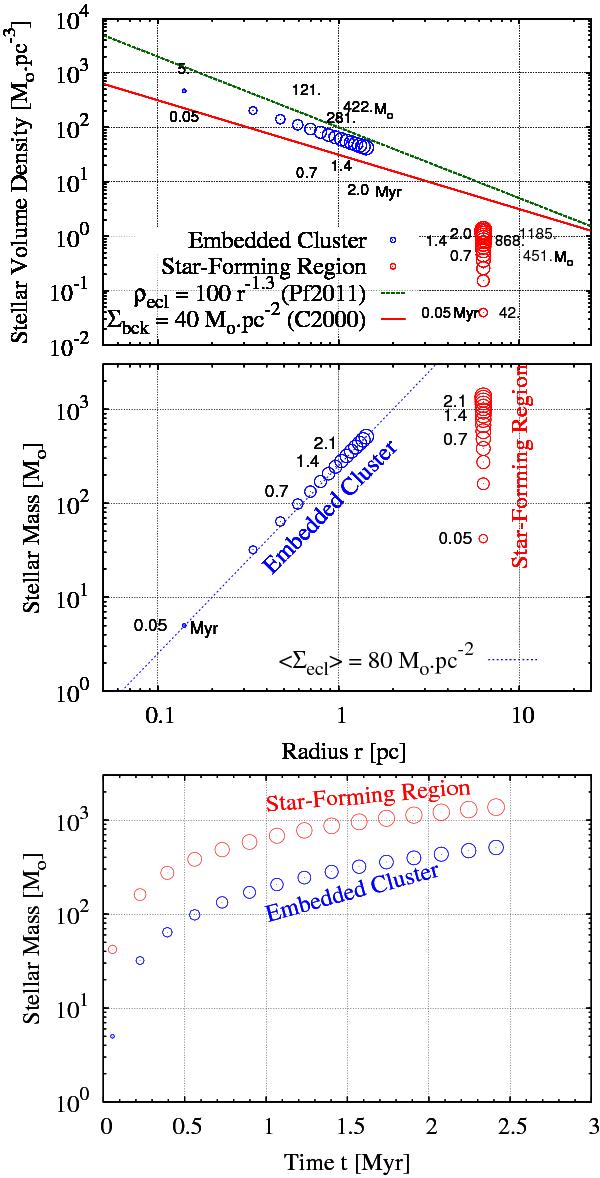
Top panel: mean volume density in dependence of radius for (i) the whole stellar component (vertical sequence of red circles at R = 6 pc); and (ii) the associated embedded cluster (decreasing sequence of blue circles on the left). The open circle size scales with the logarithm of the stellar mass. The embedded cluster refers to the part of the star-forming region seen above the stellar background against which it is seen projected (Σbck = 40 M⊙ pc-2, solid red line). As a result of the applied surface density cut-off, the predicted embedded-cluster sequence has a constant mean surface density. Also, it does not differ much from the observed embedded-cluster sequence defined by Pfalzner (2011) (dashed green line; see text for details). The times and stellar masses are given along the plotted sequences. Middle panel: mass in stars against radius, for the whole star-forming region (red vertical track to the right) and for the developing embedded cluster (blue track to the left). Quoted to the left of the sequences are the times elapsed since the onset of star-formation (in Myr). Bottom panel: same as the middle panel but for the mass-vs-time space.
Current usage metrics show cumulative count of Article Views (full-text article views including HTML views, PDF and ePub downloads, according to the available data) and Abstracts Views on Vision4Press platform.
Data correspond to usage on the plateform after 2015. The current usage metrics is available 48-96 hours after online publication and is updated daily on week days.
Initial download of the metrics may take a while.