Fig. 5
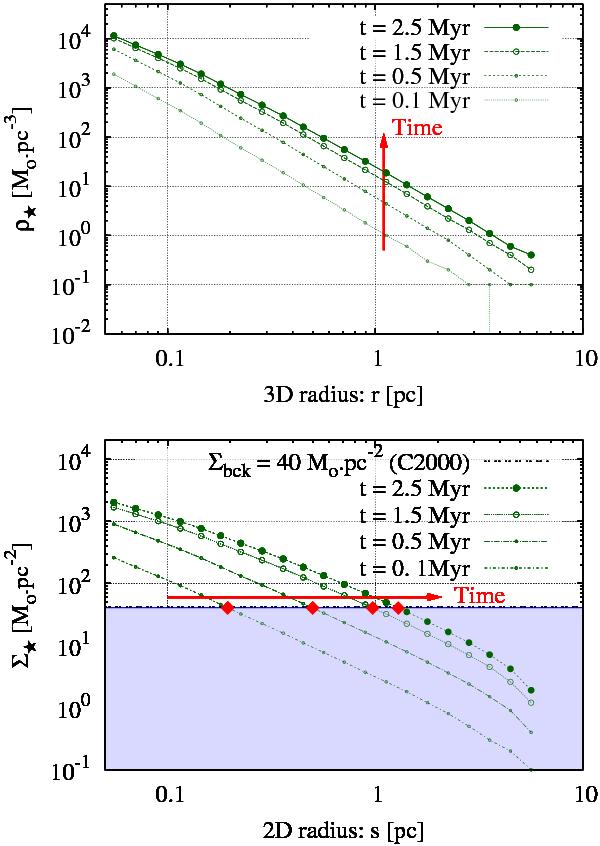
Top panel: time evolution of the volume density profile of the stellar component for the model of Sect. 2.2: M0 = 104 M⊙, R = 6 pc, ϵff = 0.1 along with p0 = 1.7. Model time spans t are given in the key. Bottom panel: time evolution of the corresponding surface density profiles superimposed with the surface density limit, Σbck, imposed by the stellar background against which the star-forming region is projected (Carpenter et al. 2000). The shaded area shows how the surface density threshold conceals the “wings” of the stellar component, leading to observed radii (red diamonds) smaller than the actual one, i.e. sbck < R.
Current usage metrics show cumulative count of Article Views (full-text article views including HTML views, PDF and ePub downloads, according to the available data) and Abstracts Views on Vision4Press platform.
Data correspond to usage on the plateform after 2015. The current usage metrics is available 48-96 hours after online publication and is updated daily on week days.
Initial download of the metrics may take a while.