Fig. 4
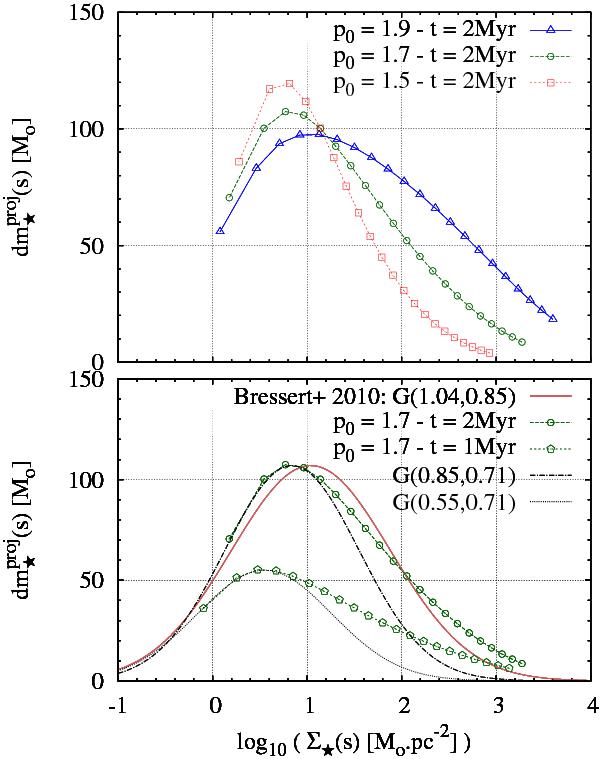
Top panel: distribution of stellar surface densities predicted by our model for a clump of mass M0 ≃ 104 M⊙, radius R ≃ 6 pc, and star formation efficiency per free-fall time ϵff = 0.1 (clump density index p0 and time t since star formation onset are given in the key). Bottom panel: two p0 = 1.7 models are shown at time t = 1 Myr and t = 2 Myr for the same molecular clump as above (lines with open symbols). The dotted and dash-dotted (black) lines depict two Gaussians fitting their low-density regime. The solid (red) line is the Gaussian given by Bressert et al. (2010) to describe the observed local surface density distribution of YSOs in the solar neighbourhood. Mean and standard deviation of all three Gaussians are given in brackets.
Current usage metrics show cumulative count of Article Views (full-text article views including HTML views, PDF and ePub downloads, according to the available data) and Abstracts Views on Vision4Press platform.
Data correspond to usage on the plateform after 2015. The current usage metrics is available 48-96 hours after online publication and is updated daily on week days.
Initial download of the metrics may take a while.