Fig. 3
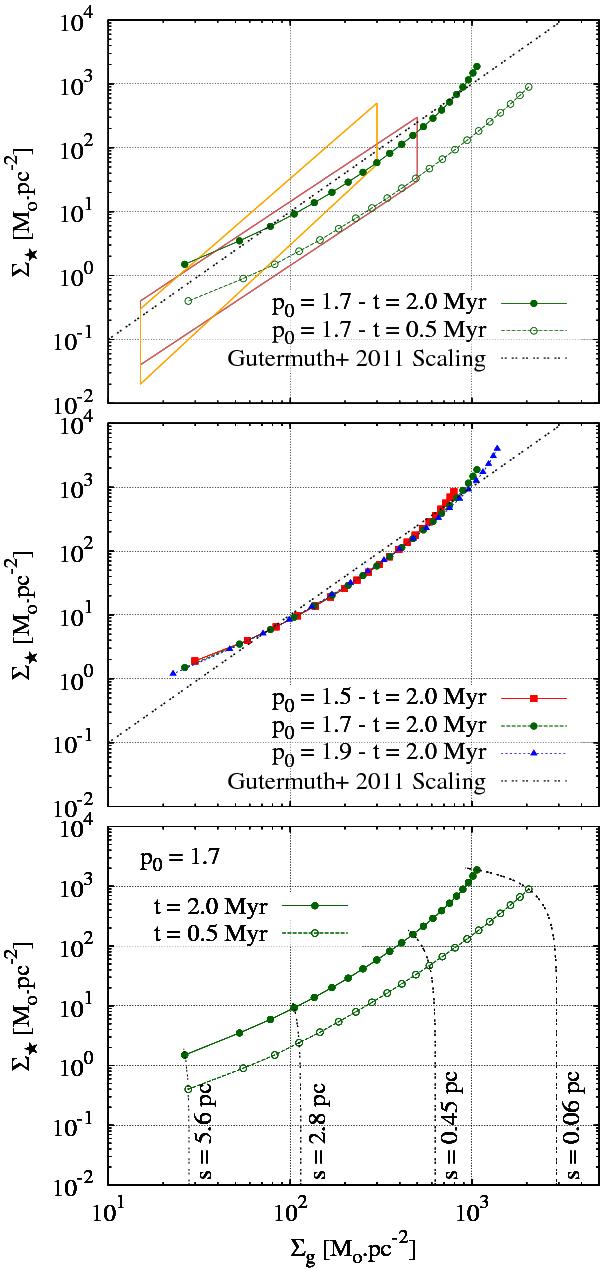
Local surface density of YSOs, Σ ⋆ , in dependence on the local surface density of the unprocessed/observed gas, Σg. Top panel: models for a molecular clump of mass M0 = 104 M⊙, radius R = 6 pc, density index p0 = 1.7, a star formation efficiency per free-fall time ϵff = 0.1 and the times t quoted in the key. The dotted (black) line depicts the average star-formation law inferred by Gutermuth et al. (2011). The orange and brown polygons illustrate the associated scatter observed for the MonR2 and Ophiuchus molecular clouds, where it is the smallest. Middle panel: models for a time t = 2 Myr and three distinct density indices of the molecular clump, p0 = 1.5, 1.7, and 1.9. The normalization of the model hardly depends on p0. Bottom panel: same as top panel but completed with the time evolution of the gas and YSO surface densities at four projected distances s from the clump centre (s-labelled dotted black lines).
Current usage metrics show cumulative count of Article Views (full-text article views including HTML views, PDF and ePub downloads, according to the available data) and Abstracts Views on Vision4Press platform.
Data correspond to usage on the plateform after 2015. The current usage metrics is available 48-96 hours after online publication and is updated daily on week days.
Initial download of the metrics may take a while.