Fig. 2
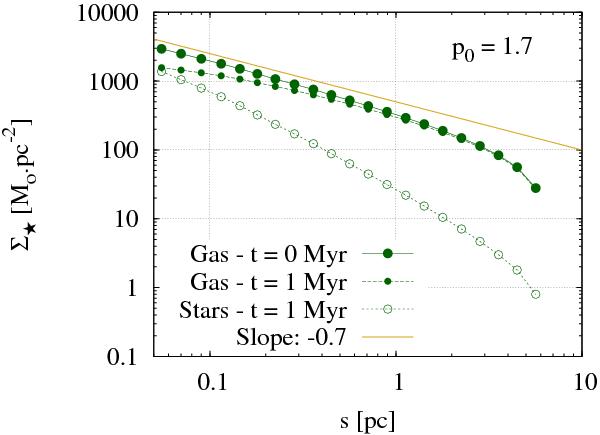
Surface density profiles from the numerical model. Lines with circles from top to bottom: the molecular clump gas initially, the unprocessed gas and the stellar component at t = 1 Myr (see key). The molecular clump is the same as in Fig. 1, and the initial gas density index is p0 = 1.7. The solid symbol-free line depicts a slope of −0.7 which is the slope expected for the initial surface density profile of the gas when p0 = 1.7. We note that in the clump outskirts, the actual surface density profile becomes increasingly steeper than the power-law approximation.
Current usage metrics show cumulative count of Article Views (full-text article views including HTML views, PDF and ePub downloads, according to the available data) and Abstracts Views on Vision4Press platform.
Data correspond to usage on the plateform after 2015. The current usage metrics is available 48-96 hours after online publication and is updated daily on week days.
Initial download of the metrics may take a while.