Fig. 15
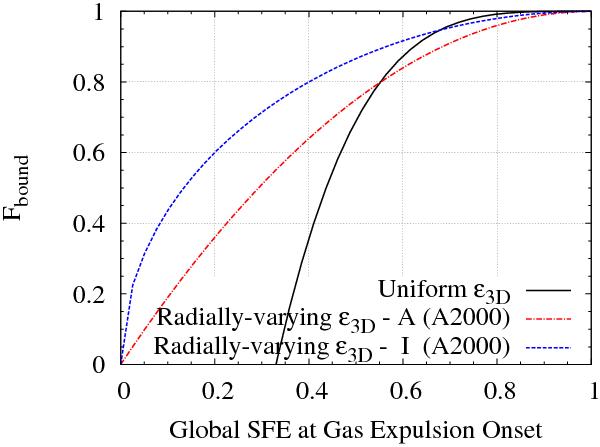
Relation between the mass fraction of the stellar component forming a bound cluster after violent relaxation, Fbound, and the global SFE of the star-forming region. The solid (black) line, taken from Parmentier & Gilmore (2007), corresponds to a uniform local star formation efficiency (i.e. ϵ3D(r) = SFE irrespective of r). The dashed and dash-dotted lines (blue and red) depict the models with radially varying star formation efficiencies of Adams (2000) (i.e. ϵ3D(r) higher at smaller r than at large r). They build on either an isotropic (“I”, see key) or anisotropic (“A”) stellar velocity distribution.
Current usage metrics show cumulative count of Article Views (full-text article views including HTML views, PDF and ePub downloads, according to the available data) and Abstracts Views on Vision4Press platform.
Data correspond to usage on the plateform after 2015. The current usage metrics is available 48-96 hours after online publication and is updated daily on week days.
Initial download of the metrics may take a while.