Fig. 12
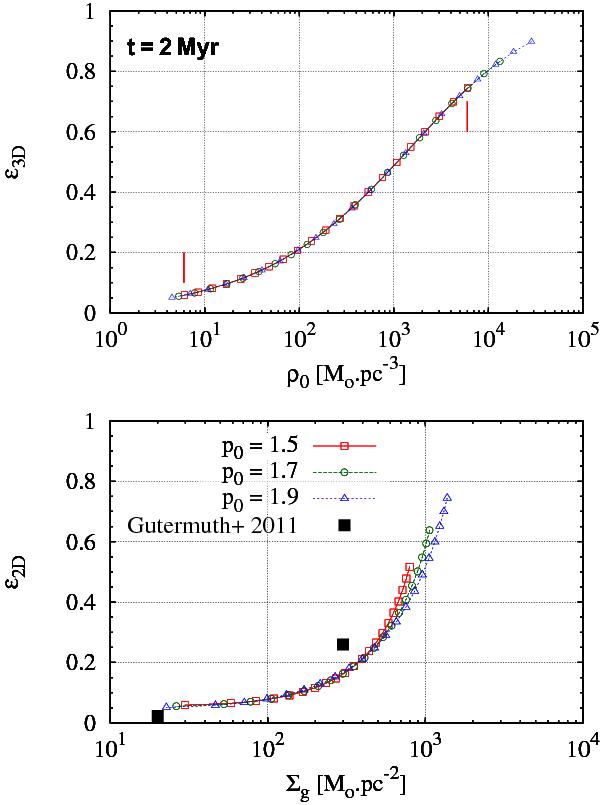
Top panel: three-dimensional star formation efficiency, ϵ3D, in dependence of the initial gas volume density, ρ0. The clump edge is on the left, the clump centre on the right. The two vertical lines mark the limits of the p0 = 1.5 model. Bottom panel: two-dimensional star formation efficiency, ϵ2D, in dependence on the residual gas surface density, Σg. The plain squares depict the measurements of Gutermuth et al. (2011). In both panels, the models are identical to those in Figs. 10 and 11.
Current usage metrics show cumulative count of Article Views (full-text article views including HTML views, PDF and ePub downloads, according to the available data) and Abstracts Views on Vision4Press platform.
Data correspond to usage on the plateform after 2015. The current usage metrics is available 48-96 hours after online publication and is updated daily on week days.
Initial download of the metrics may take a while.