Fig. 10
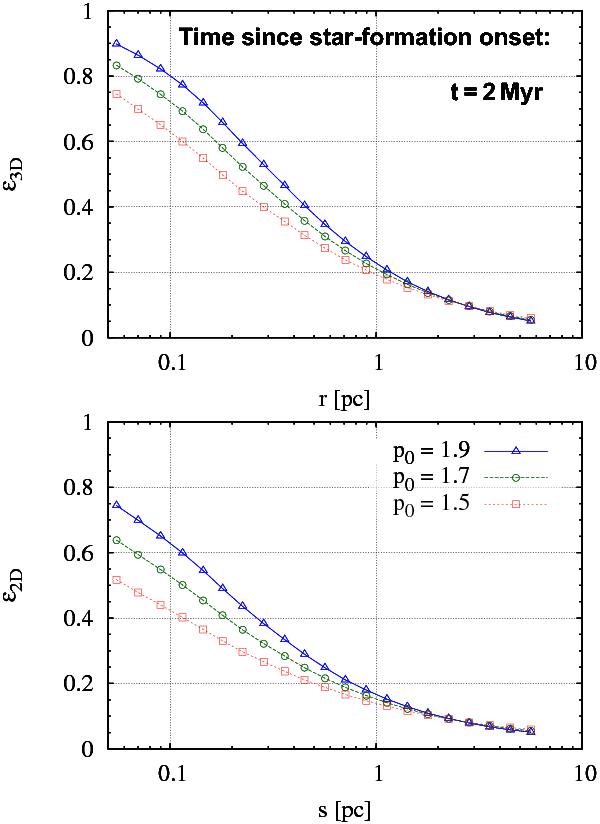
Top panel: three-dimensional local star formation efficiency, ϵ3D, as a function of radius r (Eq. (22)) for different density indices p0 (see key in bottom panel). The progenitor clump of the star-forming region is the same as previously, i.e. M0 = 104 M⊙, R = 6 pc, and ϵff = 0.1. The time elapsed since the onset of star-formation is t = 2 Myr. Bottom panel: same for the two-dimensional star formation efficiency, ϵ2D, as a function of projected radius s (Eq. (23)).
Current usage metrics show cumulative count of Article Views (full-text article views including HTML views, PDF and ePub downloads, according to the available data) and Abstracts Views on Vision4Press platform.
Data correspond to usage on the plateform after 2015. The current usage metrics is available 48-96 hours after online publication and is updated daily on week days.
Initial download of the metrics may take a while.