Fig. 1
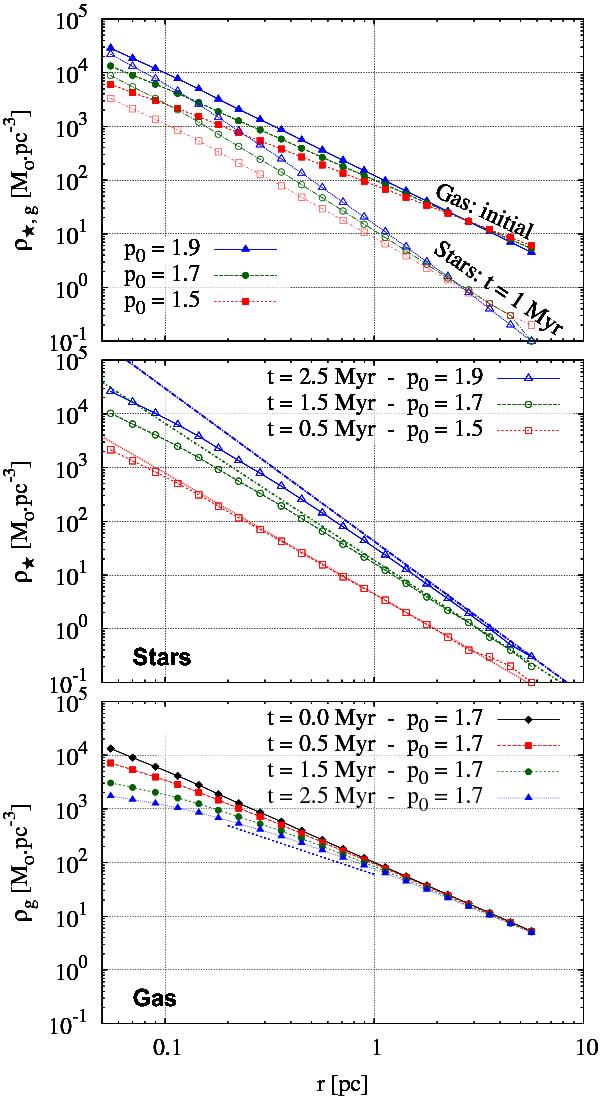
Top panel: initial gas volume density profiles (filled symbols) and their associated steeper stellar density profiles (open symbols). The latter are obtained from the numerical or analytical model one million years after star formation onset, i.e. t = 1 Myr, for three distinct p0 density indices (see key). The spherical molecular clump has a mass M0 ≃ 104 M⊙, a radius R ≃ 6 pc, and the star formation efficiency per free-fall time is ϵff = 0.1. Middle panel: stellar density profiles from the numerical model (lines with open symbols) for the times t and density indices p0 quoted in the key. Each symbol-free line is the corresponding analytical upper limit (Eq. (8)). Bottom panel: time evolution of the gas volume density profile for p0 = 1.7. The star-formation-driven depletion of the gas in the central region of the molecular clump – where the free-fall time is the shortest – is clearly highlighted. The symbol-free dotted line over the range 0.2−1 pc has a slope of −1.3, i.e. shallower than the initial slope −1.7.
Current usage metrics show cumulative count of Article Views (full-text article views including HTML views, PDF and ePub downloads, according to the available data) and Abstracts Views on Vision4Press platform.
Data correspond to usage on the plateform after 2015. The current usage metrics is available 48-96 hours after online publication and is updated daily on week days.
Initial download of the metrics may take a while.