Free Access
Fig. 3
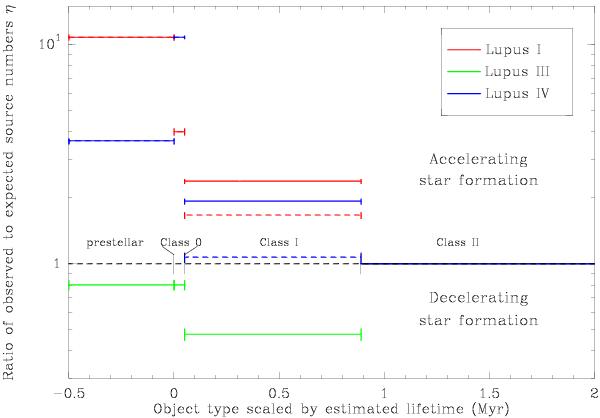
Ratio of observed-to-expected (for a constant SFR) source numbers, η, per Class. Solid lines represent the numbers from Table 1, while dashed lines show Class I without the possible galaxy contamination.
Current usage metrics show cumulative count of Article Views (full-text article views including HTML views, PDF and ePub downloads, according to the available data) and Abstracts Views on Vision4Press platform.
Data correspond to usage on the plateform after 2015. The current usage metrics is available 48-96 hours after online publication and is updated daily on week days.
Initial download of the metrics may take a while.