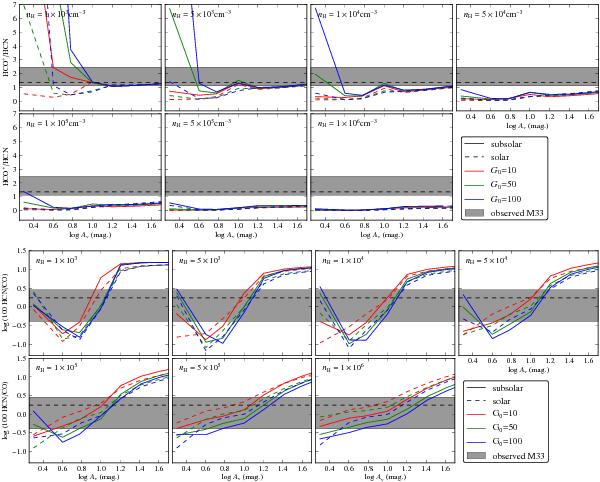
Fig. 7

PDR model line ratios for subsolar (solid lines) and solar metallicity (dashed lines): HCO+/HCN (top) and HCN/CO (bottom). Different colors indicate different FUV field strengths G0 = 10 (red), 50 (green), and 100 (blue). Every panel of a subfigure shows the results for one density; from left to right and top to bottom nH = 0.1, 0.5, 1, 5, 10, 50, and 102 × 104 cm-3. Gray areas mark the range of observed ratios in M 33. The dashed horizontal lines show the values from the stacked spectra.
Current usage metrics show cumulative count of Article Views (full-text article views including HTML views, PDF and ePub downloads, according to the available data) and Abstracts Views on Vision4Press platform.
Data correspond to usage on the plateform after 2015. The current usage metrics is available 48-96 hours after online publication and is updated daily on week days.
Initial download of the metrics may take a while.


