Fig. 6
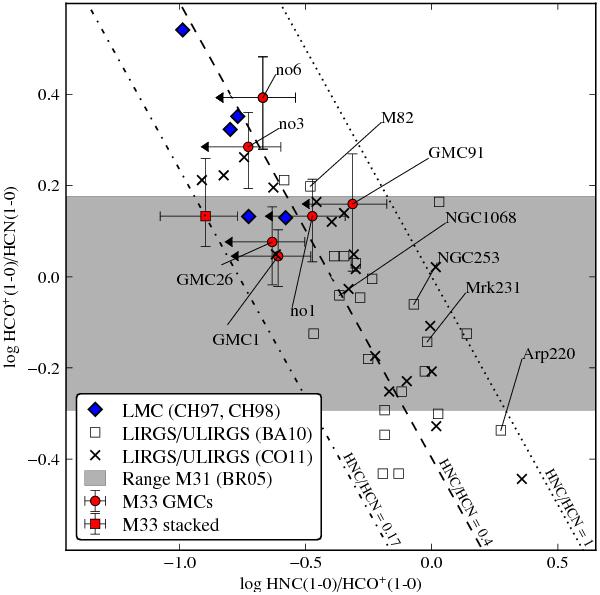
Comparison of integrated intensities HCO+/HCN vs. HNC/HCO+ in M 33 (red filled circles and square; arrows indicate upper/lower limits) with values found in the LMC (Chin et al. 1997, 1998) (CH97, CH98; blue diamonds) and in luminous infrared galaxies compiled by Baan et al. (2008) (BA08; open symbols) and by Costagliola et al. (2011) (CO11; crosses). The dotted, dashed, and dot-dashed lines shows HNC/HCN = 1, 0.4, and 0.17 (stacked value of M 33), respectively. The gray shaded area shows the range of the observed HCO+/HCN ratios in M 31 by BR05.
Current usage metrics show cumulative count of Article Views (full-text article views including HTML views, PDF and ePub downloads, according to the available data) and Abstracts Views on Vision4Press platform.
Data correspond to usage on the plateform after 2015. The current usage metrics is available 48-96 hours after online publication and is updated daily on week days.
Initial download of the metrics may take a while.