Fig. 5
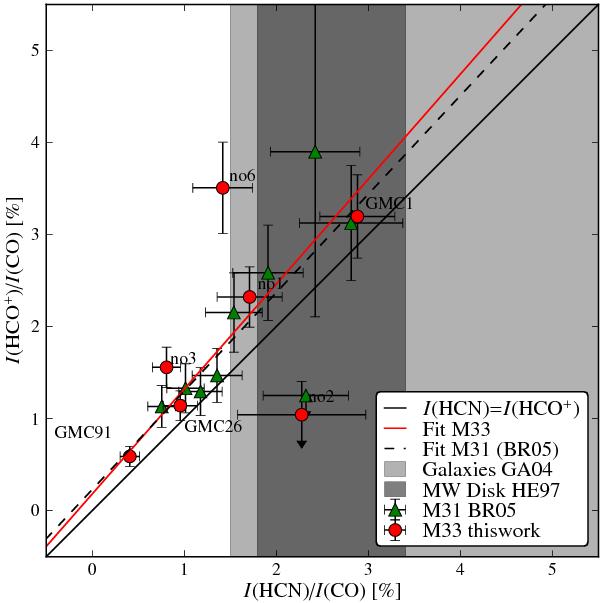
Ratios of integrated intensities HCO+/CO vs. HCN/CO for M 33 (red points: this work) and for M 31 (green points: BR05). Upper/lower limits are denoted by arrows. Linear least squares fits to data from M 33 (red solid line) and M 31 (BR05, black dashed) are shown. Both fits exclude points with upper limits. The solid black line shows the angle bisector where I(HCO+) = I(HCN). The gray shaded areas display the range of the HCN/CO found in the disk of the Milky Way (MW) by (Helfer & Blitz 1997, HE97) (darker gray) and in a sample of normal spiral galaxies (GA04b) (lighter gray).
Current usage metrics show cumulative count of Article Views (full-text article views including HTML views, PDF and ePub downloads, according to the available data) and Abstracts Views on Vision4Press platform.
Data correspond to usage on the plateform after 2015. The current usage metrics is available 48-96 hours after online publication and is updated daily on week days.
Initial download of the metrics may take a while.