Fig. 4
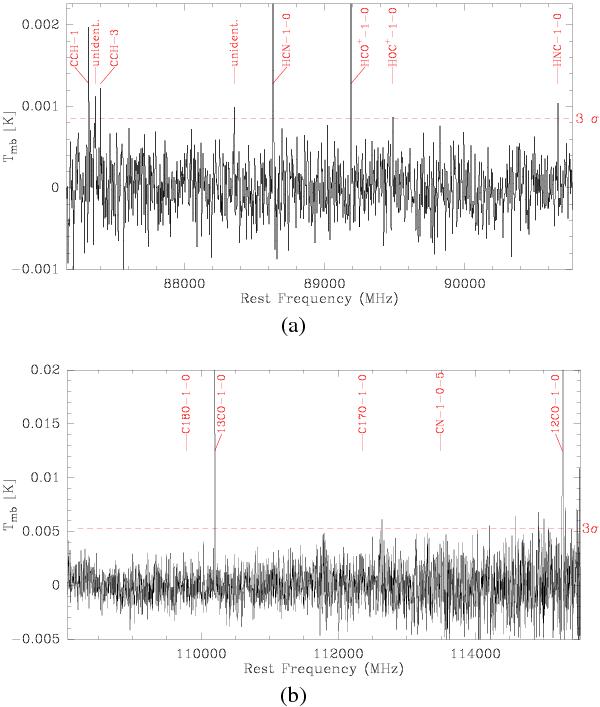
a) Stacked spectrum of all data taken in the frequency range between 87.2 and 90.8 GHz. The red dashed line denotes the 3σ value average over the entire baseline. The HCN and HCO+ lines are not shown up to their maximum peak temperature. b) Stacked spectrum of the wobbler switched data taken in the frequency range between 108.1 and 115.5 GHz. The average 3σ value is shown as red dashed line. The baseline noise increases with frequency because of the increasing atmospheric opacity. C18O, C17O, and CN are marked but not detected. The 12CO and 13CO lines are not shown up to their maximum peak temperature.
Current usage metrics show cumulative count of Article Views (full-text article views including HTML views, PDF and ePub downloads, according to the available data) and Abstracts Views on Vision4Press platform.
Data correspond to usage on the plateform after 2015. The current usage metrics is available 48-96 hours after online publication and is updated daily on week days.
Initial download of the metrics may take a while.