Fig. 2
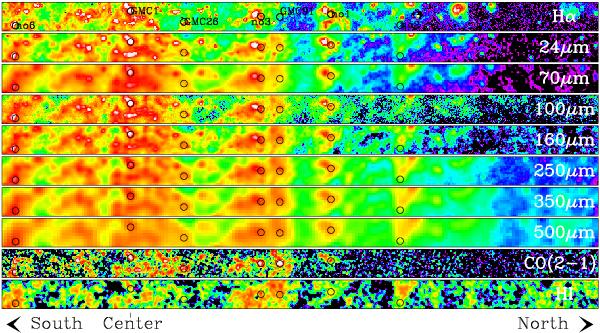
Observed positions towards seven GMCs within a 2′ × 40′ strip along the major axis of M 33. The strip extends from 10′ south of the galactic center to 33.3′ north. The center of the strip is at 01:34:11.8 +30:50:23.4 (J2000). Circles indicate the 30 m beam size of 28′′ at 90 GHz. Panels show from top to bottom: integrated intensities of H emission (Hoopes & Walterbos 2000) 24; 70 μm emission observed with Spitzer (Tabatabaei et al. 2007); continuum emission between 100 μm and 500 μm observed with PACS and SPIRE in the framework of the HerM33es program (Kramer et al. 2010; Boquien et al. 2011; Xilouris et al. 2012); 12CO 2–1 30 m observation and H i VLA data, both taken from Gratier et al. (2010). All data are shown at their original resolutions.
Current usage metrics show cumulative count of Article Views (full-text article views including HTML views, PDF and ePub downloads, according to the available data) and Abstracts Views on Vision4Press platform.
Data correspond to usage on the plateform after 2015. The current usage metrics is available 48-96 hours after online publication and is updated daily on week days.
Initial download of the metrics may take a while.