| Issue |
A&A
Volume 548, December 2012
|
|
|---|---|---|
| Article Number | A94 | |
| Number of page(s) | 2 | |
| Section | Atomic, molecular, and nuclear data | |
| DOI | https://doi.org/10.1051/0004-6361/201220174 | |
| Published online | 29 November 2012 | |
Research Note
The hyperfine structure in the rotational spectrum of CF+
1
IRAM, 300 rue de la
Piscine, 38406
Saint-Martin d’Hères
France
e-mail: This email address is being protected from spambots. You need JavaScript enabled to view it.
2
LUTH UMR 8102, CNRS and Observatoire de Paris,
Place J. Janssen, 92195
Meudon Cedex,
France
3
Institut für Physikalische Chemie, Universität
Mainz, 55099
Mainz,
Germany
4
LERMA – LRA, UMR 8112, Observatoire de Paris and École normale
Supérieure, 24 rue
Lhomond, 75231
Paris,
France
5
Centro de Astrobiología, CSIC-INTA, Carretera de Ajalvir, Km 4, Torrejón de Ardoz,
28850
Madrid,
Spain
6
European Space Astronomy Centre, ESA, PO Box 78, 28691
Villanueva de la Cañada,
Madrid,
Spain
Received: 6 August 2012
Accepted: 1 November 2012
Abstract
Context. CF+ has recently been detected in the Horsehead and Orion Bar photo-dissociation regions. The J = 1−0 line in the Horsehead is double-peaked in contrast to other millimeter lines. The origin of this double-peak profile may be kinematic or spectroscopic.
Aims. We investigate the effect of hyperfine interactions due to the fluorine nucleus in CF+ on the rotational transitions.
Methods. We compute the fluorine spin rotation constant of CF+ using high-level quantum chemical methods and determine the relative positions and intensities of each hyperfine component. This information is used to fit the theoretical hyperfine components to the observed CF+ line profiles, thereby employing the hyperfine fitting method in GILDAS.
Results. The fluorine spin rotation constant of CF+ is 229.2 kHz. This way, the double-peaked CF+ line profiles are well fitted by the hyperfine components predicted by the calculations. The unusually large hyperfine splitting of the CF+ line therefore explains the shape of the lines detected in the Horsehead nebula, without invoking intricate kinematics in the UV-illuminated gas.
Key words: astrochemistry / ISM: clouds / ISM: molecules / ISM: individual objects: Horsehead nebula / radio lines: ISM
© ESO, 2012
1. Introduction
Up to now, CF+ has only been detected in two photo-dissociation regions (PDR), namely the Horsehead mane (Guzmán et al. 2012) and the Orion bar (Neufeld et al. 2006). In contrast to other mm lines in the Horsehead, the CF+J = 1−0 (102.587 GHz) line is double-peaked. Guzmán et al. (2012) proposed three possible explanations: 1) the CF+ line suffers from self-absorption; 2) the complex CF+ line profile is caused by kinematics; or 3) the two peaks correspond to different hyperfine components caused by the fluorine nuclei. As the CF+ opacities are low (τ ≲ 1), the radiative transfer explanation could be ruled out. However, Guzmán et al. (2012) could not distinguish between the remaining possibilities for two reasons. First, CF+ is expected to coexist with C+, because CF+ is formed by the reaction of HF with C+. This implies that the lines of both C+ and CF+ may share similar kinematics and indeed the 157.8 μm C+ line is double-peaked. Second, no experimental or theoretical investigation of the hyperfine structure of CF+ was available. The most recent spectroscopic study of CF+ did not consider the hyperfine structure because the experiments were not able to resolve the hyperfine components (Cazzoli et al. 2010). High-level quantum chemical calculations reported in the following now allow us to determine the hyperfine splitting. It is thus possible to establish the spectroscopic origin of the double-peak line in the Horsehead PDR.
2. Hyperfine structure
CF+ has a  electronic ground state with a dipole moment of 1.04 Debye (Peterson et al. 1990). The fluorine nuclei has a non-zero nuclear spin (I = 1/2). Therefore, the rotational and spin angular momenta are coupled through J + I = F. This implies that the total angular momentum F can have the values F = I + J,I + J − 1,...,|I − J|, where J is the rotational and I the nuclear spin quantum number. The various combinations of these quantum numbers are responsible for the hyperfine splitting of the energy levels, which are given by
 ![Mathematical equation: \begin{equation} E = E_J + \frac{C_I}{2} \left [ F(F+1) - I(I+1) - J(J+1) \right ], \end{equation}](/articles/aa/full_html/2012/12/aa20174-12/aa20174-12-eq13.png) (1)with CI as the spin rotation constant. The frequency splitting of the two hyperfine lines is equal to 3/2 CI for the J = 1−0 transition. For the J = 2−1 transition, there are three hyperfine lines separated by CI and 5/2 CI from the strongest transition (Townes & Schawlow 1975).
(1)with CI as the spin rotation constant. The frequency splitting of the two hyperfine lines is equal to 3/2 CI for the J = 1−0 transition. For the J = 2−1 transition, there are three hyperfine lines separated by CI and 5/2 CI from the strongest transition (Townes & Schawlow 1975).
The CF+ spin rotation constant has been determined by means of quantum chemical calculations (see, e.g., Puzzarini et al. 2010, for details). To ensure high accuracy, the computations were performed at the coupled-cluster singles and doubles level augmented by a perturbative treatment of triple excitations (CCSD(T), Raghavachari et al. 1989) together with atomic-orbital basis sets from Dunning’s cc-pCVXZ hierarchy with X = Q, 5, and 6 (Woon & Dunning 1995). Rotational London orbitals (Gauss et al. 1996) were used in all calculations. Furthermore, zero-point vibrational effects were accounted for in a perturbative manner as described in Auer et al. (2003) at the CCSD(T)/cc-pCVQZ level. The values computed for r(CF) = 1.154089 Å are 227.5 kHz (cc-pCVQZ), 228.5 kHz (cc-pCV5Z), and 228.7 kHz (cc-pCV6Z), respectively. Vibrational corrections amount to 0.55 kHz, thus leading to a final theoretical value of 229.2 kHz for the spin rotation constant of CF+. All calculations were performed with the quantum chemical program package CFour1.
Table 1 gives the resulting hyperfine frequency shifts together with the relative line intensities, taking a CF+ spin rotation constant of 229.2 kHz. This value is higher than, e.g., the 13CO value of 32.6 kHz (Cazzoli et al. 2004). This makes CF+ a spectroscopically peculiar ion. Indeed, extrapolating from the spectroscopy of 13CO, Guzmán et al. (2012) significantly underestimated the hyperfine splitting of the J = 1−0 line by assuming a value of about 165 kHz. The computed value of the spin rotation constant agrees with the fact that the hyperfine splittings were not observed in the experiments of Cazzoli et al. (2010).
Hyperfine splitting shifts with respect to the strongest transition and relative intensities.
3. Comparison with observations
The hyperfine fitting method available in the GILDAS/CLASS software2 was used to fit the CF+ hyperfine components to the available astronomical data. The fits and their residuals are shown in Fig. 1. Table 2 gives the results of the fits, namely the local standard of rest (LSR) velocity, the linewidth, and the total opacity of the line. The observed lines are well fitted and the column density inferred from the fitted total opacity is N = (1.8−3.5) × 1012 cm-2, i.e., less than a factor two from the value inferred in Guzmán et al. (2012). The frequency splitting and relative intensities of the two peaks in the CF+ J = 1−0 line emission profile are consistent with two hyperfine components due to the fluorine nucleus. The two strongest hyperfine components in the J = 2−1 line are separated by only 0.3 km s-1 at the LSR velocity associated to the Horsehead nebula while the typical linewidth of the lines is ~0.6 km s-1. The velocity separation of the third hyperfine component is much larger, but its relative intensity is weak (less than 10%). Therefore, the three hyperfine components are not easily disentangled at 1 mm. Nevertheless, the line profile is also compatible with the computed hyperfine splitting, as shown on the residuals. The fitted velocities for both lines are 10.7 km s-1; i.e., they are equal to the usual systematic velocity of all the lines detected in the Horsehead WHISPER survey (PI: J. Pety). This way, the observed CF+ double-peak profile can be fully explained spectroscopically. This result demonstrates the importance of multidisciplinary collaborations to interpret astrophysical observations.
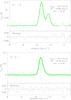 |
Fig. 1 CF+J = 1−0 and J = 2−1 line profiles detected toward the Horsehead PDR. The vertical lines indicate the positions and the relative intensities of the hyperfine components. The green lines display the hyperfine fit performed with the CLASS tool in GILDAS. The fit residuals are shown in the bottom panels. |
Results of the hyperfine component fit.
The difference in typical linewidth explains why the hyperfine splitting was not detected in the Orion bar (1.5−3.0 km s-1, Neufeld et al. 2006). The Horsehead (showing narrow emission lines) is a perfect laboratory for precise spectroscopic studies of species present in UV-illuminated environments.
See http://www.cfour.de for more information about the CFour package.
See http://www.iram.fr/IRAMFR/GILDAS for more information about the GILDAS softwares.
Acknowledgments
V.G. acknowledges support from the Chilean Government through the Becas Chile scholarship program. This work was also funded by grant ANR-09-BLAN-0231-01 from the French Agence Nationale de la Recherche as part of the SCHISM project and in Mainz by the Deutsche Forschungsgemeinschaft through grant GA 370/5-1. J.R.G. thanks the Spanish MICINN for support through grants AYA2009-07304 and CSD2009-00038. J.R.G. is also supported by a Ramón y Cajal research contract from the Spanish MICINN and co-financed by the European Social Fund.
References
- Auer, A. A., Gauss, J., & Stanton, J. F. 2003, J. Chem. Phys., 118, 10407 [NASA ADS] [CrossRef] [Google Scholar]
- Cazzoli, G., Puzzarini, C., & Lapinov, A. V. 2004, ApJ, 611, 615 [NASA ADS] [CrossRef] [Google Scholar]
- Cazzoli, G., Cludi, L., Puzzarini, C., & Gauss, J. 2010, A&A, 509, A1 [NASA ADS] [CrossRef] [EDP Sciences] [Google Scholar]
- Gauss, J., Ruud, K., & Helgaker, T. 1996, J. Chem. Phys., 105, 2804 [NASA ADS] [CrossRef] [Google Scholar]
- Guzmán, V., Pety, J., Gratier, P., et al. 2012, A&A, 543, L1 [NASA ADS] [CrossRef] [EDP Sciences] [Google Scholar]
- Neufeld, D. A., Schilke, P., Menten, K. M., et al. 2006, A&A, 454, L37 [NASA ADS] [CrossRef] [EDP Sciences] [Google Scholar]
- Peterson, K., Woods, R. C., Rosmus, P., & Werner, H.-J. 1990, J. Chem. Phys., 93, 1889 [NASA ADS] [CrossRef] [Google Scholar]
- Puzzarini, C., Stanton, J. F., & Gauss, J. 2010, Int. Rev. Phys. Chem., 29, 273 [CrossRef] [Google Scholar]
- Raghavachari, K., Trucks, G. W., Pople, J. A., & Head-Gordon, M. 1989, Chem. Phys. Lett., 157, 479 [NASA ADS] [CrossRef] [Google Scholar]
- Townes, C. H., & Schawlow, A. L. 1975, Microwave spectroscopy [Google Scholar]
- Woon, K., & Dunning, T. H. 1995, J. Chem. Phys., 103, 4572 [NASA ADS] [CrossRef] [Google Scholar]
All Tables
Hyperfine splitting shifts with respect to the strongest transition and relative intensities.
All Figures
|
Fig. 1 CF+J = 1−0 and J = 2−1 line profiles detected toward the Horsehead PDR. The vertical lines indicate the positions and the relative intensities of the hyperfine components. The green lines display the hyperfine fit performed with the CLASS tool in GILDAS. The fit residuals are shown in the bottom panels. |
| In the text | |
Current usage metrics show cumulative count of Article Views (full-text article views including HTML views, PDF and ePub downloads, according to the available data) and Abstracts Views on Vision4Press platform.
Data correspond to usage on the plateform after 2015. The current usage metrics is available 48-96 hours after online publication and is updated daily on week days.
Initial download of the metrics may take a while.