Free Access
Fig. 1
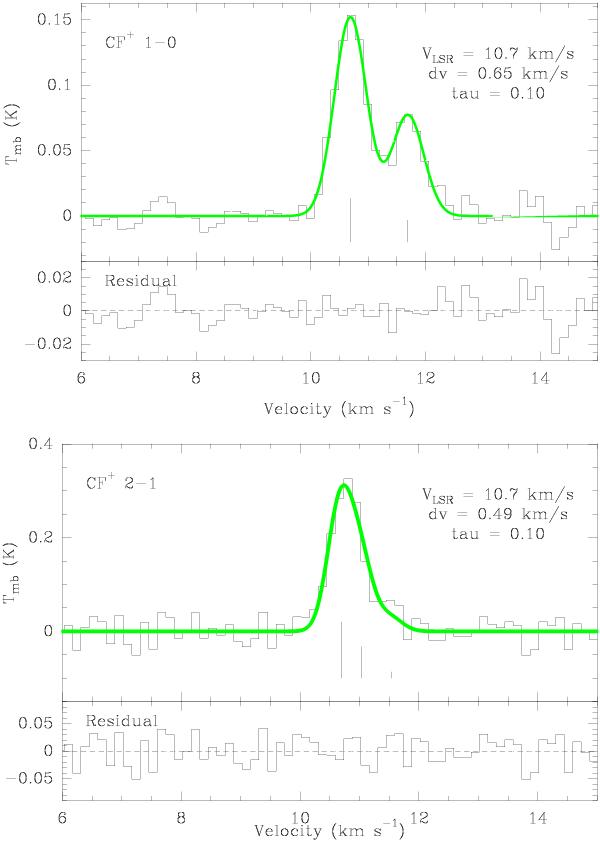
CF+J = 1−0 and J = 2−1 line profiles detected toward the Horsehead PDR. The vertical lines indicate the positions and the relative intensities of the hyperfine components. The green lines display the hyperfine fit performed with the CLASS tool in GILDAS. The fit residuals are shown in the bottom panels.
This figure is made of several images, please see below:
Current usage metrics show cumulative count of Article Views (full-text article views including HTML views, PDF and ePub downloads, according to the available data) and Abstracts Views on Vision4Press platform.
Data correspond to usage on the plateform after 2015. The current usage metrics is available 48-96 hours after online publication and is updated daily on week days.
Initial download of the metrics may take a while.