| Issue |
A&A
Volume 548, December 2012
|
|
|---|---|---|
| Article Number | A13 | |
| Number of page(s) | 9 | |
| Section | Stellar structure and evolution | |
| DOI | https://doi.org/10.1051/0004-6361/201220166 | |
| Published online | 12 November 2012 | |
The Galactic unclassified B[e] star HD 50138
III. The short-term line profile variability of its photospheric lines⋆,⋆⋆,⋆⋆⋆
1
Observatório Nacional,
Rua General José Cristino 77,
20921-400,
São Cristovão
Rio de Janeiro,
Brazil
e-mail: This email address is being protected from spambots. You need JavaScript enabled to view it.
; This email address is being protected from spambots. You need JavaScript enabled to view it.
2
Astronomický ústav, Akademie věd České republiky, Fričova 298,
251 65
Ondřejov, Czech
Republic
e-mail: This email address is being protected from spambots. You need JavaScript enabled to view it.
; This email address is being protected from spambots. You need JavaScript enabled to view it.
, This email address is being protected from spambots. You need JavaScript enabled to view it.
3
Royal Observatory of Belgium, Ringlaan 3, 1180
Brussels,
Belgium
e-mail: This email address is being protected from spambots. You need JavaScript enabled to view it.
; This email address is being protected from spambots. You need JavaScript enabled to view it.
Received: 3 August 2012
Accepted: 23 September 2012
Abstract
Context. HD 50138 presents the B[e] phenomenon, but its nature is not clear yet. This star is known to present spectral variations, which have been associated with outbursts and shell phases.
Aims. We analyze the line profile variability of HD 50138 and its possible origin, which provide possible hints to its evolutionary stage, so far said to be close to the end of (or slightly beyond) the main sequence.
Methods. New high-resolution spectra of HD 50138 obtained with the HERMES spectrograph over several nights (five of them consecutively) were analyzed, allowing us to confirm short-term line profile variability.
Results. Our new data show short-term variations in the photospheric lines. On the other hand, purely circumstellar lines (such as [O i] lines) do not show such rapid variability. The rotational velocity of HD 50138, νrot = 90.3 ± 4.3 km s-1, and the rotation period, P = 3.64 ± 1.16 d, were derived from the He i λ4026 photospheric line. Based on the moment method, we confirm that the origin of this short-term line profile variability is not stellar spots, and it may be caused by pulsations. In addition, we show that macroturbulence may affect the profiles of photospheric lines, as is seen for B supergiants.
Conclusions. The location of HD 50138 at the end of (or slightly beyond) the main sequence, the newly detected presence of line profile variability resembling pulsating stars, and macroturbulence make this star a fascinating object.
Key words: stars: oscillations / stars: mass-loss / stars: winds, outflows / circumstellar matter / stars: individual: HD 50138
Based on observations made with the Mercator Telescope, operated on the island of La Palma by the Flemish Community, at the Spanish Observatorio del Roque de los Muchachos of the Instituto de Astrofísica de Canarias.
Figures 3–7 are available in electronic form at http://www.aanda.org
Reduced spectra are only available at the CDS via anonymous ftp to cdsarc.u-strasbg.fr (130.79.128.5) or via http://cdsarc.u-strasbg.fr/viz-bin/qcat?J/A+A/548/A13
© ESO, 2012
1. Introduction
The group of B[e] stars displays, in their optical spectrum, strong Balmer emission lines and emission from permitted and forbidden transitions of neutral and singly ionized metals. In addition, B[e] stars show circumstellar dust, which is responsible for the excess emission in the near and mid-infrared. Especially in the Galaxy, many B[e] stars are still unclassified with respect to their evolutionary phase, mainly due to unknown or uncertain stellar parameters and especially distances. In addition, they are often embedded in dense circumstellar material. Consequently, their optical spectra are strongly polluted with circumstellar emission, while unpolluted photospheric lines, which are needed for a proper stellar classification, are rare or absent.
The star HD 50138 (V743 Mon, MWC 158) is one of these Galactic unclassified B[e] stars (Lamers et al. 1998), although strong effort has been undertaken to determine its stellar parameters. Borges Fernandes et al. (2009, hereafter Paper I) reclassified it as a B6-7 III-V star based on high-resolution optical spectra and discussed several evolutionary scenarios. It seems that HD 50138 might be a star that is close to the end of its main-sequence evolution. This indicates that this star may represent a link between B[e] and Be stars. Shell phases and outbursts of this star have been reported, based on line profile variabilities (Merrill 1931; Merrill & Burwell 1933; Hutsemékers 1985; Andrillat & Houziaux 1991; Pogodin 1997). And indeed, photometric observations have shown a drop in UBV magnitudes by about 0.2 mag, which is interpreted as an outburst around 1978/79. In Paper I, it was also suggested that a new shell phase took place prior to 2007.
It is also important to point out that HD 50138 is often discussed in the framework of Herbig Ae/Be stars (see Paper I). Based on the absence of any nebulosity around it, as well as the absence of a close-by star-forming region, it could be “an isolated” HAeB[e] star. However, such a classification is unlikely because of the presence of shell phases and outbursts, which are typical of more evolved B[e] stars.
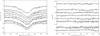 |
Fig. 1 He i λ4026 line. The left panel shows its time series and the right panel shows the night-to-night residuals. The time increases from bottom (2011-02-19) to top (2011-02-27), and for a better visual inspection of the spectra, they are slightly shifted along the vertical axis with offsets proportional to the interval between the observations, considering the barycentric Julian dates. |
The presence of a circumstellar disk has been inferred from polarimetric and spectro-polarimetric observations that revealed an intrinsic polarization in agreement with a non-spherically symmetric distribution of the circumstellar material (Vaidya et al. 1994; Bjorkman et al. 1998; Oudmaijer & Drew 1999; Harrington & Kuhn 2007). Recently, Borges Fernandes et al. (2011, hereafter Paper II), based on interferometric measurements, confirmed the presence of a gaseous and dusty disk around HD 50138. The orientation on the sky plane and a proper inclination angle of 56° ± 4° were also derived. From both spectroscopic and interferometric observations, the presence of a companion is unlikely, although it cannot be definitely excluded yet.
To better understand the nature of its spectral variability, we re-observed HD 50138 during several nights (most of which were consecutive) in 2011. Thus, we present in Sect. 2 our observations and data reduction. In Sect. 3, we present our results from these high-quality spectra and in Sects. 4 and 5, we discuss the new facts about HD 50138 and present our conclusions, respectively.
2. Observations
High-quality optical spectra were obtained with the High Efficiency and Resolution Mercator Echelle Spectrograph (HERMES) attached to the 1.2-m Mercator telescope at the Roque de los Muchachos Observatory on La Palma (Canary Islands, Spain). HERMES is a fiber-fed spectrograph (Raskin et al. 2011) and our data were obtained in the high-resolution mode (HRF), which provides a spectral resolution of R ≃ 85 000 and a field of view of 2.5 arcsec2. The wavelength coverage extends from 3770 Å to 9000 Å. For a proper reduction we used the automated data reduction pipeline, HermesDRS, which includes the barycentric correction.
The observations were obtained during eight nights in the period 2011 February 19 to 27. Five of the nights were consecutive. During each night, for optimum cosmic ray elimination, we took two consecutive spectra, which were checked for any line variability, and in the case of no change, were then combined for a better signal-to-noise ratio (S/N). Details on the resulting spectra are summarized in Table 1.
Journal of available spectra.
3. Results
3.1. Line profile variability
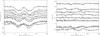 |
Fig. 2 As in Fig. 1, but for Si ii λλ4128,4131 lines. The radial velocity was derived as a function of the wavelength of rest of the λ4128 line. |
The spectrum of HD 50138, as presented in Paper I, is dominated by lines from neutral and singly ionized elements. It also presents a rich diversity of line profiles from emission to pure absorption lines, including several lines with a combination of absorption and emission components.
Line profile variability has previously been reported in the literature and associated with shell phases and outbursts (Merrill 1931; Merrill & Burwell 1933; Hutsemékers 1985; Andrillat & Houziaux 1991; Pogodin 1997). Paper I reported long-term variability in the high-resolution spectra taken eight years apart. The variability seen in several lines was interpreted as a new shell phase, which took place prior to 2007.
On the other hand, Pogodin (1997) also reported night-to-night variability in the line profiles, from spectra taken in four consecutive nights in March 1994, but covering small spectral regions. From our HERMES data taken during several consecutive nights with higher resolution and broader wavelength coverage, we confirm this short-term variability for a large sample of lines of different chemical elements. In Figs. 1 through 9, we show some examples of the lines seen in our spectra, noting the different strengths of variability, which seem to be related to the formation region of these lines.
The spectrum of HD 50138 displays a few photospheric lines. In fact, the only purely photospheric lines seem to be He i λ4026 and Si ii λλ4128,4131. These lines, as can be seen by their residuals1 in Figs. 1 and 2, do not display strong variability. These lines are known to be formed at deeper atmospheric layers. Other possible photospheric lines like He i λ 4009, 4124, and 4123 are hardly detected, and He i λ 4388 is blended in our spectra.
On the other hand, lines like the red doublet of Si ii λλ6347,6371 (Figs. 3 and 4), He i lines in the red portion of the spectrum, such as He i λ6678 (Fig. 5) and the core of the higher Balmer lines (Figs. 6 and 7), present strong variations from night to night. These lines are formed in the upper layers of the stellar atmosphere or very close to the stellar surface, and are extremely sensitive to an enhancement or reduction of the local density due to any disturbance in their formation regions.
The emission lines of circumstellar origin, such as the forbidden lines [O i] λλ6300,6364, are quite stable. This can be seen in the Fig. 8 for the [O i] λ6364 line and its residuals. Since no telluric correction was performed for our data, we do not present the [O i] λ6300 line, which is polluted by telluric lines.
However, the same stability is not seen for Hα, as can be seen from its residuals (Fig. 9). Hα is usually formed in the outer photosphere and lower (ionized) wind or disk region (1−5 R ∗ ), while the [O i] lines are formed at much greater distances (>100 R ∗ ), where the disk material is already predominantely neutral (Kraus et al. 2007, 2010).
3.2. Rotational velocity
The stellar rotational velocity projected to the line of sight (νsini) can be determined from photospheric lines that are neither blended nor polluted by emission. As mentioned previously, the spectrum of HD 50138 shows only three purely photospheric lines: He i λ4026 and Si ii λλ4128,4131. However, the obvious large line width results in blending of the Si ii lines so that we are left with a single line, the He i λ4026 line. It can thus be regarded as the only feasible photospheric line.
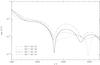 |
Fig. 10 Position of the first zero point in the Fourier transform of the line profiles of the He i λ4026 line. |
To determine νsini we applied the well established Fourier method (e.g., Gray 1976; Simón-Díaz & Herrero 2007). The Fourier transform of the stellar rotation profile possesses zero points, and the first zero is inversely proportional to νsini. To obtain reasonable results, the spectra are required to have both a high spectral resolution and a high S/N. While the HERMES spectrograph provides an excellent resolution with R ~ 85 000, some of our data suffer from poor S/N. We therefore restricted the analysis to four spectra with reasonable S/N values. The results are presented in Fig. 10. The agreement in the position of the first zero point in the Fourier transform of these lines is excellent. The νsini values obtained from these zero points are listed in Table 2, and the resulting mean value is νsini = 74.7 ± 0.8 km s-1.
Earlier attempts to derive the projected stellar rotational velocity of HD 50138 have been made by Corporon & Lagrange (1999) and Frémat et al. (2006), who obtained values for νsini of 50 ± 30 and 60 ± 10 km s-1, respectively. Considering the large error bars obtained by these authors, their values are in reasonably good agreement with our value. Corporon & Lagrange (1999) measured their value from the He i λλ4472, 6678 lines, which are both highly variable in our spectra (for He i λ6678 line see Fig. 5). Also Frémat et al. (2006) used highly variable lines like the He i and Mg ii lines at λλ4472, 4481, and their S/N was considerably lower than ours with about 150. Our value, which is obtained from the He i λ4026 line, the stablest line in the whole spectrum, can thus be regarded as reliable.
Considering in addition an inclination of i = 56° ± 4° of the star as obtained for its dusty disk from an analysis of interferometric observations in Paper II, the stellar rotational velocity of HD 50138 becomes νrot = 90.3 ± 4.3 km s-1. Applying the stellar parameters obtained in Paper I, the rotational period of HD 50138 is P = 3.64 ± 1.16 d.
Next we computed synthetic, rotationally broadened photospheric line profiles for stellar parameters of Teff = 13 000 K and log g = 4.0, in agreement with Paper I, which we fitted to the observed He i and Si ii lines, seen in the combined spectrum of 2011-02-27. These are shown as the dashed lines in Fig. 11.
Rotational velocities (νsini) derived from the Hei λ4026 line.
Comparing the synthetic and observed profiles, it is obvious that stellar rotation alone cannot account for the observed line width. This is particularly evident for the Si ii lines (top panel of Fig. 11). To fit the observed profiles it was necessary to broaden the lines with an additional, Gaussian shaped profile. The needed amount of the extra velocity broadening was about 30−40 km s-1. Line profile fits using these two values are shown in Fig. 11 as dotted and solid lines, respectively.
The presence of such an excess broadening was also reported for another group of stars, the B supergiants (e.g., Ryans et al. 2002; Simón-Díaz & Herrero 2007; Markova & Puls 2008). These stars are furthermore known to display strong line profile variability (e.g., Kaufer et al. 1997; 2006; Lefever et al. 2007; Markova et al. 2008; Clark et al. 2010), and recent studies by Simón-Díaz et al. (2010) have revealed that a correlation exists between line profile variability in B supergiants and their excess broadening, which is usually referred to as “macroturbulence”.
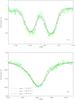 |
Fig. 11 Fit of the observed Si ii (top) and He i (bottom) lines with synthetic photospheric lines, using stellar parameters in agreement with Paper I, broadened with stellar rotation and macroturbulence. |
3.3. Moment analysis
While the origin of the macroturbulence velocity seen in the line widths of B supergiants was long unclear, recent studies by Aerts et al. (2009) suggest that the broadening might result from many (hundreds) individual contributions provided by stellar pulsations. If pulsations could be a plausible explanation for the excess broadening seen in the He i line of the non-supergiant B[e] star HD 50138, then this line should also show profile variability to at least some extent. Since the residuals of this line do not reveal any obvious variability, a more thorough analysis of its profile is needed to unveil any small-scale (periodical) variability.
To investigate the putatively stable He i line in more detail, we make use of the moment method, which is an excellent tool for studying even small-scale line profile variabilities and distinguishing between different physical mechanisms as the origin of the variabilities, such as (non-)radial pulsations and stellar spots. But for a reliable distinction between the two scenarios (pulsations versus chemical surface inhomogeneities in the form of spots), the variability in different chemical elements needs to be investigated. Besides the He i λ4026 line, we therefore included the Si ii λλ4128,4131 lines in the analysis, but keeping in mind that the results of these lines probably have a higher uncertainty because of their blending. We followed the description of Aerts et al. (1992) and North & Paltani (1994) by computing the equivalent width, together with the first three moments of these lines. Due to their poor quality, the spectra taken on 2011-02-20 and 2011-02-21 were excluded.
Figure 12 shows the resulting time variation of the equivalent widths and the first three moments, which represent the radial velocity (⟨ ν1 ⟩ ), a measure of the width (⟨ ν2 ⟩ ), and the skewness (⟨ ν3 ⟩ ) of the line. Quite clearly, all three lines show variability in their first three moments, while their equivalent widths (zeroeth moment) remain relatively stable. The amplitude in radial velocity variation is on the order of 10 km s-1. It is slightly higher in the Si ii lines. This might explain why the residuals in those lines show some signal (see Fig. 2), while those of the He i λ4026 line are almost featureless.
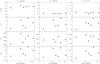 |
Fig. 12 Variation in the equivalent widths and first three moments calculated for the He i λ4026 and Si ii λλ4128,4131 with time. The moments ⟨ ν1 ⟩ , ⟨ ν2 ⟩ , and ⟨ ν3 ⟩ , have units (km s-1), (km s-1)2, and (km s-1)3, respectively. |
4. Discussion
The very similar variation in both He i and Si ii lines makes it unlikely that their variabilities could originate in a star with a heterogeneous surface abundance pattern in the form of stellar spots. Such stars usually show a quite different behavior in the variability seen in their helium lines with respect to those in their metal lines (see, e.g., Briquet et al. 2001; 2004; Lehmann et al. 2006).
In addition, the line profiles in spotted stars vary with their rotational period. Owing to an insufficient time coverage of our observations (only one data point per night), a search for periodicity in the moments failed. However, the rapid change in radial velocity from −5 to about +10 km s-1 in the Hei line within less than 26 h (from BJD 17.416 to 18.473), while it showed a steady decrease from ~6 to ~−5 km s-1 during the three preceding nights, might indicate (using a tentative sine curve fit) a possible (maximum) period of ~1.7 days, but the real period could also be (much) shorter. This needs to be studied on time series of spectroscopic observations taken with a much better time resolution.
Consequently, the variability in the lines of HD 50138 is also not connected with the rotation period of ~3.6 days. Instead, it resembles those seen in pulsating stars. In addition, the strong short-term variability of the line profiles is mainly contained in the lines formed in the upper layers of the stellar atmosphere or very close to the stellar surface (like the core of the higher Balmer lines), while the lines formed in the circumstellar environment (like the [O i] lines) are not affected by these night-to-night variations. It is interesting to point out that two pulsating late-type Be stars exist and occupy a similar region in the Hertzsprung-Russell diagram as our object (see Fig. 13).
In addition, the fact that macroturbulence is present in the photospheric lines of HD 50138, a known property of B supergiants, and its classification as a star at the end of (or slightly beyond) the main sequence, makes it a fascinating object.
5. Conclusions
Based on new high-resolution spectra of HD 50138 obtained during eight nights (five of them consecutive), we confirm the presence of short-term variability in a large sample of lines of different elements. These spectral variations have different strengths depending on the line formation region. The strongest short-term variability is identified in the profiles of lines arising in the upper layers of the stellar atmosphere or very close to the stellar surface.
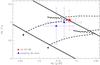 |
Fig. 13 Hertzsprung-Russell diagram showing two pulsating late-type Be stars in comparison with HD 50138. Parameters of the Be stars are from Neiner et al. (2009) and Diago et al. (2009). Solid lines encompass the main sequence, dashed lines represent the evolutionary tracks for stars with MZAMS = 4 and 5 M⊙. |
Analyzing the few present photospheric lines, we derived the rotational velocity and rotational period of HD 50138, νrot = 90.3 ± 4.3 km s-1 and P = 3.64 ± 1.16 d, respectively. We conclude that the short-term line profile variability is not connected with this rotation period. In addition, we used the moment method to study the origin of the line profile variability and discard any possibility that there are stellar spots, which suggest pulsations as the origin of the short-term variations identified. However, from our data it was not possible to determine the modes of these pulsations. Nevertheless, the scenario of pulsations, though putative at that moment, might also favor the appearance of shell phases as reported in Paper I. As in pulsating Be stars, these mass ejections could be associated to possible beat periods.
These new results, accompanied by the probable macroturbulence in the photospheric lines, reveal the fascinating and complex properties of HD 50138, an object clearly in need of more detailed study. An observational campaign to obtain more data of higher quality, in a longer temporal series, is definitely necessary. From these data, it will be possible to precisely determine the real origin of the line profile variations and consequently the nature of this star.
Online material
All available spectra were added and a mean spectrum was obtained and then, the residuals were calculated as the ratio of the individual ones with the mean spectrum.
Acknowledgments
This research made use of the NASA Astrophysics Data System (ADS). The authors acknowledge the referee, Dr. Mikhail Pogodin, for his useful comments, which allowed us to improve our manuscript. MBF acknowledges Conselho Nacional de Desenvolvimento Científico e Tecnológico (CNPq-Brazil) for the post-doctoral grant. M.K., D.H.N., and M.E.O. acknowledge financial support from GAČR under grant number P209/11/1198. The Astronomical Institute Ondřejov is supported by the project RVO:67985815.
References
- Aerts, C., De Pauw, M., & Waelkens, C. 1992, A&A, 266, 294 [NASA ADS] [Google Scholar]
- Aerts, C., Puls, J., Godart, M., & Dupret, M.-A. 2009, A&A, 508, 409 [NASA ADS] [CrossRef] [EDP Sciences] [Google Scholar]
- Andrillat, Y., & Houziaux, L. 1991, IAUC, 5164, 3 [NASA ADS] [Google Scholar]
- Bjorkman, K. S., Miroshnichenko, A. S., Bjorkman, J. E., et al. 1998, ApJ, 509, 904 [NASA ADS] [CrossRef] [Google Scholar]
- Borges Fernandes, M., Kraus, M., Chesneau, O., et al. 2009, A&A, 508, 309 (Paper I) [NASA ADS] [CrossRef] [EDP Sciences] [Google Scholar]
- Borges Fernandes, M., Meilland, A., Bendjoya, P., et al. 2011, A&A, 528, A20 (Paper II) [NASA ADS] [CrossRef] [EDP Sciences] [Google Scholar]
- Briquet, M., De Cat, P., Aerts, C., & Scuflaire, R. 2001, A&A, 380, 177 [NASA ADS] [CrossRef] [EDP Sciences] [Google Scholar]
- Briquet, M., Aerts, C., Lüftinger, T., et al. 2004, A&A, 413, 273 [NASA ADS] [CrossRef] [EDP Sciences] [Google Scholar]
- Clark, J. S., Ritchie, B. W., & Negueruela, I. 2010, A&A, 514, A87 [NASA ADS] [CrossRef] [EDP Sciences] [Google Scholar]
- Corporon, P., & Lagrange, A.-M. 1999, A&AS, 136, 429 [NASA ADS] [CrossRef] [EDP Sciences] [Google Scholar]
- Diago, P. D., Gutiérrez-Soto, J., Auvergne, M., et al. 2009, A&A, 506, 125 [NASA ADS] [CrossRef] [EDP Sciences] [Google Scholar]
- Frémat, Y., Neiner, C., Hubert, A.-M., et al. 2006, A&A, 451, 1053 [NASA ADS] [CrossRef] [EDP Sciences] [Google Scholar]
- Gray, D. F. 1976, The observation and analysis of stellar photospheres (New York: Wiley) [Google Scholar]
- Harrington, D. M., & Kuhn, J. R. 2007, ApJ, 667, 89 [Google Scholar]
- Hutsemékers, D. 1985, A&AS, 60, 373 [NASA ADS] [Google Scholar]
- Kaufer, A., Stahl, O., Wolf, B., et al. 1997, A&A, 320, 273 [NASA ADS] [Google Scholar]
- Kaufer, A., Stahl, O., Prinja, R. K., & Witherick, D. 2006, A&A, 447, 325 [NASA ADS] [CrossRef] [EDP Sciences] [Google Scholar]
- Kraus, M., Borges Fernandes, M., & de Araújo, F. X. 2007, A&A, 463, 627 [NASA ADS] [CrossRef] [EDP Sciences] [Google Scholar]
- Kraus, M., Borges Fernandes, M., & de Araújo, F. X. 2010, A&A, 517, A30 [NASA ADS] [CrossRef] [EDP Sciences] [Google Scholar]
- Lamers, H. J. G. L. M., Zickgraf, F.-J., de Winter, D., Houziaux, L., & Zorec, J. 1998, A&A, 340, 117 [NASA ADS] [Google Scholar]
- Lehmann, H., Tsymbal, V., Mkrtichian, D. E., & Fraga, L. 2006, A&A, 457, 1033 [NASA ADS] [CrossRef] [EDP Sciences] [Google Scholar]
- Lefever, K., Puls, J., & Aerts, C. 2007, A&A, 463, 1093 [NASA ADS] [CrossRef] [EDP Sciences] [Google Scholar]
- Markova, N., & Puls, J. 2008, A&A, 478, 823 [NASA ADS] [CrossRef] [EDP Sciences] [Google Scholar]
- Markova, N., Prinja, R. K., Markov, H., et al. 2008, A&A, 487, 211 [NASA ADS] [CrossRef] [EDP Sciences] [Google Scholar]
- Merrill, P. W. 1931, ApJ, 73, 348 [NASA ADS] [CrossRef] [Google Scholar]
- Merrill, P. W., & Burwell, C. G. 1933, ApJ, 78, 87 [NASA ADS] [CrossRef] [Google Scholar]
- Neiner, C., Gutiérrez-Soto, J., Baudin, F., et al. 2009, A&A, 506, 143 [NASA ADS] [CrossRef] [EDP Sciences] [Google Scholar]
- North, P., & Paltani, S. 1994, A&A, 288, 155 [NASA ADS] [Google Scholar]
- Oudmaijer, R. D., & Drew, J. E. 1999, MNRAS, 305, 166 [NASA ADS] [CrossRef] [Google Scholar]
- Pogodin, M. A. 1997, A&A, 317, 185 [NASA ADS] [Google Scholar]
- Raskin, G., van Winckel, H., Hensberge, H., et al. 2011, A&A, 526, A69 [NASA ADS] [CrossRef] [EDP Sciences] [Google Scholar]
- Ryans, R. S. I., Dufton, P. L., Rolleston, W. R. J., et al. 2002, MNRAS, 336, 577 [NASA ADS] [CrossRef] [Google Scholar]
- Simón-Díaz, S., & Herrero, A. 2007, A&A, 468, 1063 [NASA ADS] [CrossRef] [EDP Sciences] [Google Scholar]
- Simón-Díaz, S., Herrero, A., Uytterhoeven, K., et al. 2010, ApJ, 720, L174 [NASA ADS] [CrossRef] [Google Scholar]
- Vaidya, A., Schulte-Ladbeck, R. E., & Bjorkman, K. S. 1994, BAAS, 26, 933 [NASA ADS] [Google Scholar]
All Tables
All Figures
|
Fig. 1 He i λ4026 line. The left panel shows its time series and the right panel shows the night-to-night residuals. The time increases from bottom (2011-02-19) to top (2011-02-27), and for a better visual inspection of the spectra, they are slightly shifted along the vertical axis with offsets proportional to the interval between the observations, considering the barycentric Julian dates. |
| In the text | |
|
Fig. 2 As in Fig. 1, but for Si ii λλ4128,4131 lines. The radial velocity was derived as a function of the wavelength of rest of the λ4128 line. |
| In the text | |
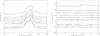 |
Fig. 8 As in Fig. 1, but for [O i] λ6364 line. |
| In the text | |
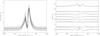 |
Fig. 9 As in Fig. 1, but for Hα λ6563 line. |
| In the text | |
|
Fig. 10 Position of the first zero point in the Fourier transform of the line profiles of the He i λ4026 line. |
| In the text | |
|
Fig. 11 Fit of the observed Si ii (top) and He i (bottom) lines with synthetic photospheric lines, using stellar parameters in agreement with Paper I, broadened with stellar rotation and macroturbulence. |
| In the text | |
|
Fig. 12 Variation in the equivalent widths and first three moments calculated for the He i λ4026 and Si ii λλ4128,4131 with time. The moments ⟨ ν1 ⟩ , ⟨ ν2 ⟩ , and ⟨ ν3 ⟩ , have units (km s-1), (km s-1)2, and (km s-1)3, respectively. |
| In the text | |
|
Fig. 13 Hertzsprung-Russell diagram showing two pulsating late-type Be stars in comparison with HD 50138. Parameters of the Be stars are from Neiner et al. (2009) and Diago et al. (2009). Solid lines encompass the main sequence, dashed lines represent the evolutionary tracks for stars with MZAMS = 4 and 5 M⊙. |
| In the text | |
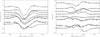 |
Fig. 3 As in Fig. 1, but for Si ii λ6347 line. |
| In the text | |
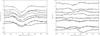 |
Fig. 4 As in Fig. 1, but for Si ii λ6371 line. |
| In the text | |
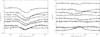 |
Fig. 5 As in Fig. 1, but for He i λ6678 line. |
| In the text | |
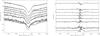 |
Fig. 6 As in Fig. 1, but for H 10 λ3798 line. |
| In the text | |
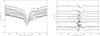 |
Fig. 7 As in Fig. 1, but for H 9 λ3835 line. |
| In the text | |
Current usage metrics show cumulative count of Article Views (full-text article views including HTML views, PDF and ePub downloads, according to the available data) and Abstracts Views on Vision4Press platform.
Data correspond to usage on the plateform after 2015. The current usage metrics is available 48-96 hours after online publication and is updated daily on week days.
Initial download of the metrics may take a while.