Fig. A.1
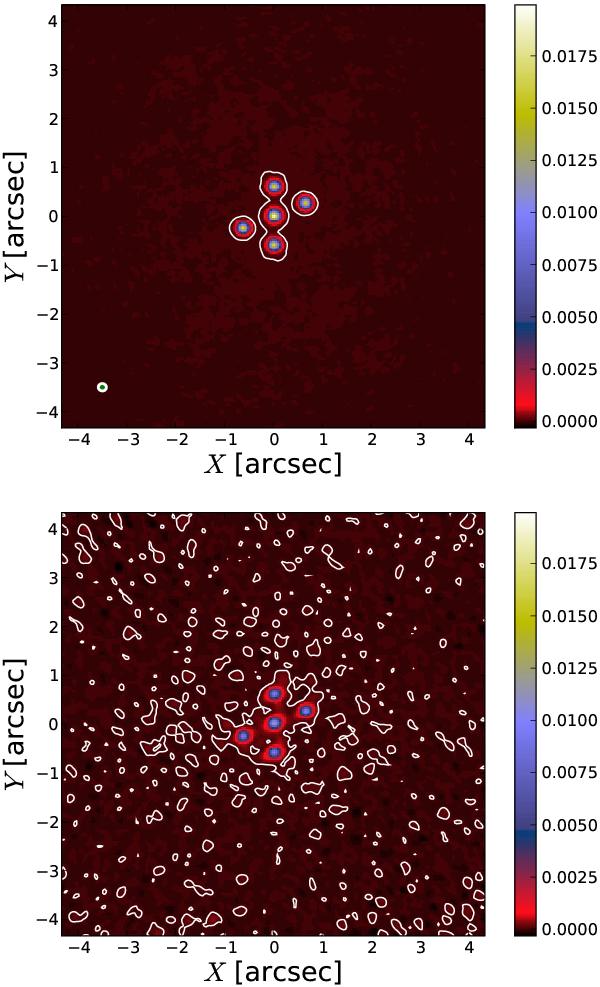
Brightness distribution maps, in Jy/beam, for two cases considered in section A. The top plot shows the case of an error-free observation at 144 GHz with ALMA in configuration C = 20, combined with single-dish. The bottom plot shows the case of an observation with the same combination of instruments, but with 0.6′′ pointing errors on all antennas, thermal noise as described in the text, and uncorrected atmospheric phase noise with a 45° rms phase difference on 300-m baselines. Contours on both plots correspond to the 3σS sensitivity limit given by the ALMA Sensitivity Calculator, where σS = 17.41 μJy for the typical atmospheric conditions in band B = 4.
Current usage metrics show cumulative count of Article Views (full-text article views including HTML views, PDF and ePub downloads, according to the available data) and Abstracts Views on Vision4Press platform.
Data correspond to usage on the plateform after 2015. The current usage metrics is available 48-96 hours after online publication and is updated daily on week days.
Initial download of the metrics may take a while.