Fig. 3
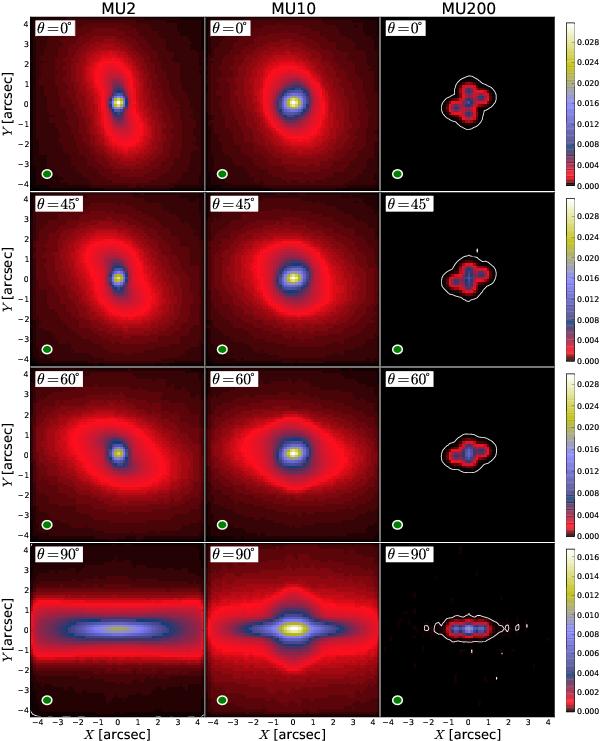
Brightness distribution maps in Jy/beam, output by the ALMA simulator in band B = 3 (100 GHz), and array configuration C = 15. Magnetization level decreases from left to right, and inclination angle θ increases from top to bottom. Contours show the 3σS sensitivity limit in this band, as given by the ALMA Sensitivity Calculator. Here σS = 14.55 μJy. The synthesized beam is shown in the bottom left corner of each plot. For a given θ, color scales are identical across all columns.
Current usage metrics show cumulative count of Article Views (full-text article views including HTML views, PDF and ePub downloads, according to the available data) and Abstracts Views on Vision4Press platform.
Data correspond to usage on the plateform after 2015. The current usage metrics is available 48-96 hours after online publication and is updated daily on week days.
Initial download of the metrics may take a while.