Fig. 1
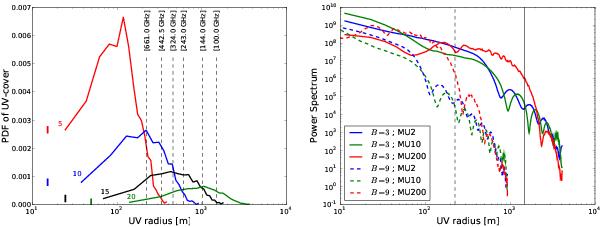
Left: probability density function from the distribution of samples in the u − v plane for the 4 configurations used here (numbers 5, 10, 15, and 20, indicated next to each curve) as a function of u − v radius  . The relevant parameters are the source position and duration of observation, which are described in Sect. 2.3. The small vertical lines indicate the minimum baseline for each configuration. Also marked, with dashed lines, are characteristic baselines duv = cD/(2πν0d) corresponding to a physical size d = 10 AU at a distance D = 150 pc, for the six frequencies ν0. Right: power spectra of the input maps at 100 GHz (solid lines) and 661 GHz (dashed lines) for θ = 0°. The wavenumber axis has been rescaled to match the u − v radius of the left plot. The vertical black lines mark the positions of the 10 AU scale at 150 pc at these frequencies (solid for 100 GHz, dashed for 661 GHz, reported from left plot).

Current usage metrics show cumulative count of Article Views (full-text article views including HTML views, PDF and ePub downloads, according to the available data) and Abstracts Views on Vision4Press platform.
Data correspond to usage on the plateform after 2015. The current usage metrics is available 48-96 hours after online publication and is updated daily on week days.
Initial download of the metrics may take a while.