Free Access
Fig. 6
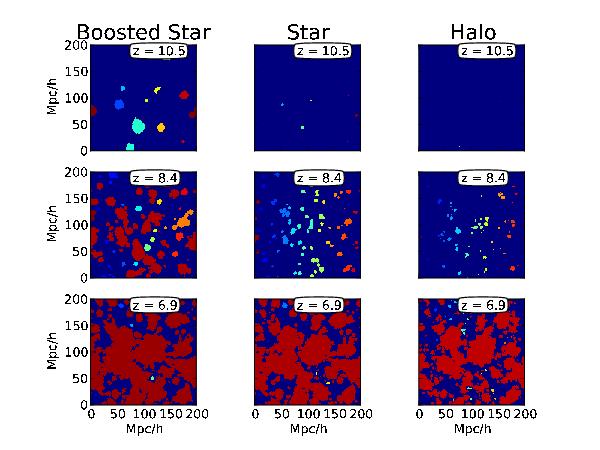
Ionization map for the three ionizing sources models for three distinct redshift for the 200 Mpc/h size box. The colors encode the different identification number allocated to the HII regions by the FOF algorithm.
Current usage metrics show cumulative count of Article Views (full-text article views including HTML views, PDF and ePub downloads, according to the available data) and Abstracts Views on Vision4Press platform.
Data correspond to usage on the plateform after 2015. The current usage metrics is available 48-96 hours after online publication and is updated daily on week days.
Initial download of the metrics may take a while.