Fig. 3
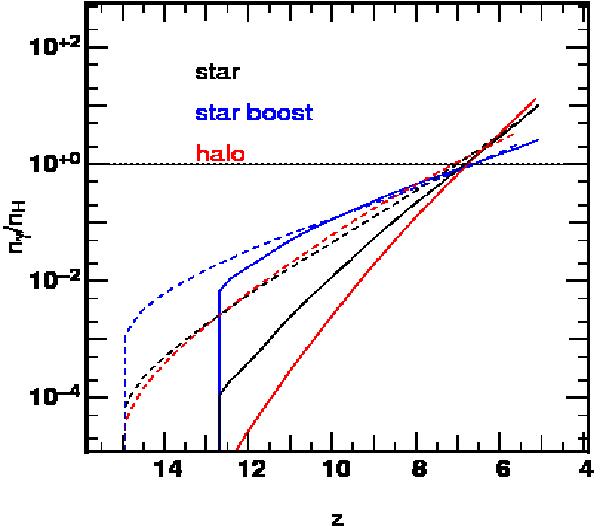
Redshift evolution of the cumulative number of ionizing photons emitted by the sources relative to the number of hydrogen atoms. The horizontal line stand for one photon per atom. Solid (resp. dashed) lines stand for the 200 (resp. 50) Mpc/h simulations. Black, blue, and red curve stand respectively for the star, Boosted Star and Halo models of ionizing sources.
Current usage metrics show cumulative count of Article Views (full-text article views including HTML views, PDF and ePub downloads, according to the available data) and Abstracts Views on Vision4Press platform.
Data correspond to usage on the plateform after 2015. The current usage metrics is available 48-96 hours after online publication and is updated daily on week days.
Initial download of the metrics may take a while.