Fig. A.2
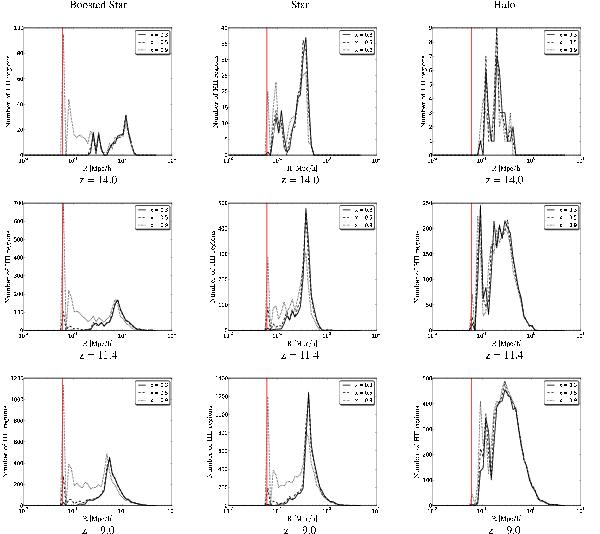
Representation of the radius distribution of all HII regions at three different redshifts for the three simulations for the 50 Mpc/h box. We compare the difference in the radius distribution according to the ionization threshold for the detection of the HII region with the FOF procedure. We represent the volume of one single cell by the vertical red line.
Current usage metrics show cumulative count of Article Views (full-text article views including HTML views, PDF and ePub downloads, according to the available data) and Abstracts Views on Vision4Press platform.
Data correspond to usage on the plateform after 2015. The current usage metrics is available 48-96 hours after online publication and is updated daily on week days.
Initial download of the metrics may take a while.