Free Access
Fig. 1
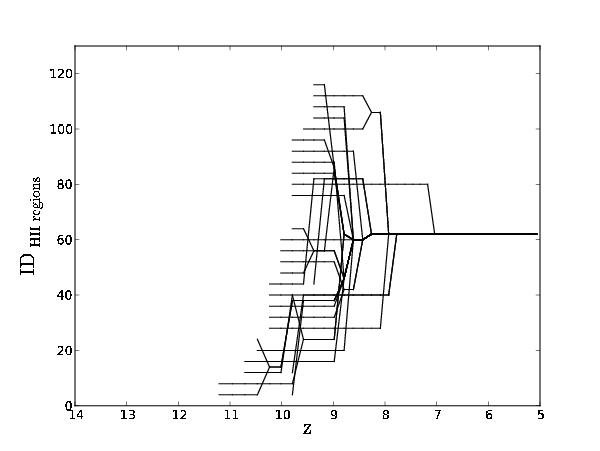
Illustration of the merger tree of HII regions. Each black line represents an ID evolution with the redshift for a distinct HII region. For clarity, we represent here only the ID evolution for 30 regions.
Current usage metrics show cumulative count of Article Views (full-text article views including HTML views, PDF and ePub downloads, according to the available data) and Abstracts Views on Vision4Press platform.
Data correspond to usage on the plateform after 2015. The current usage metrics is available 48-96 hours after online publication and is updated daily on week days.
Initial download of the metrics may take a while.