Fig. 4
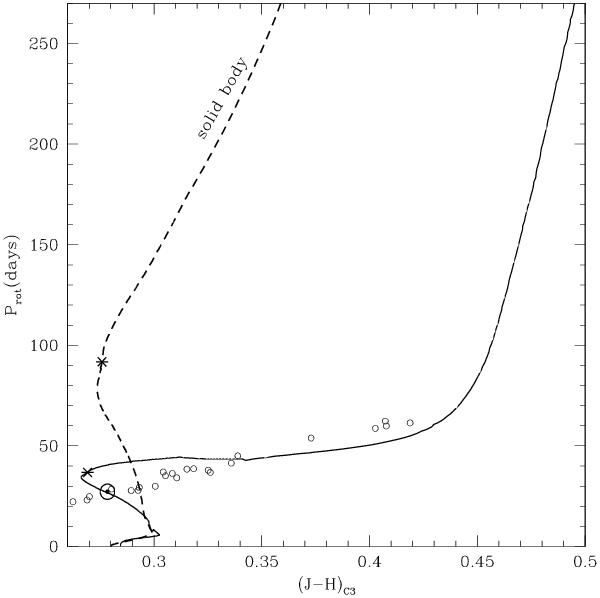
Rotation period evolution from the main sequence to the giant branch as a function of the (J − H)C3 index. The models are shown for [Fe/H] = 0 and 1 M⊙. The dashed line represents the rotation period evolution for a solid-body model. The solid line represents the computed model with differential rotation. Open circles represent subgiants with masses of about one solar mass and rotational periods determined from the rotation-activity relation by Lovis et al. (2011). Asterisk as in Fig. 3.
Current usage metrics show cumulative count of Article Views (full-text article views including HTML views, PDF and ePub downloads, according to the available data) and Abstracts Views on Vision4Press platform.
Data correspond to usage on the plateform after 2015. The current usage metrics is available 48-96 hours after online publication and is updated daily on week days.
Initial download of the metrics may take a while.