Free Access
Fig. 1
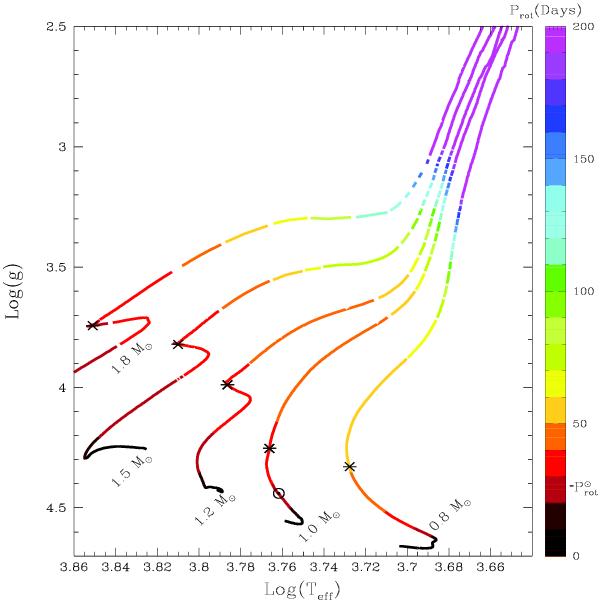
Log(g) − Teff diagram. Evolutionary models for [Fe/H] = 0.0 and for 0.8, 1.0, 1.2, 1.5, and 1.8 solar masses. The color pallet denotes the evolution of rotation period for each model. The Sun is flagged and the beginning of the subgiant branch (turn-off point) is marked with an asterisk.
Current usage metrics show cumulative count of Article Views (full-text article views including HTML views, PDF and ePub downloads, according to the available data) and Abstracts Views on Vision4Press platform.
Data correspond to usage on the plateform after 2015. The current usage metrics is available 48-96 hours after online publication and is updated daily on week days.
Initial download of the metrics may take a while.