Free Access
Fig. 3
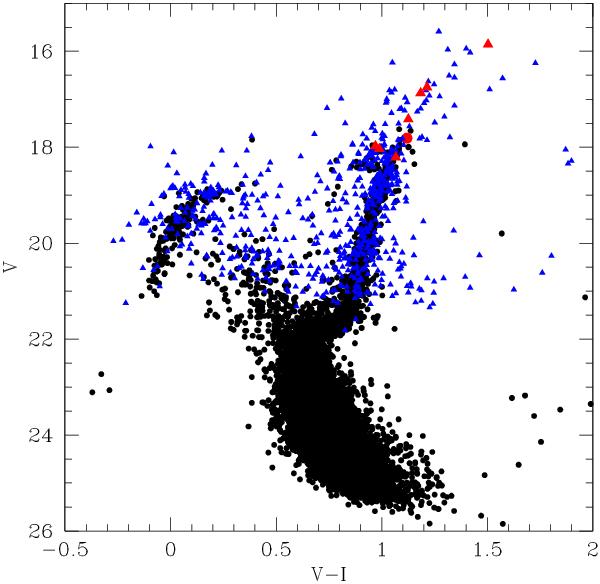
Color–magnitude diagram for H11. Black dots: photometry from FORS2(VLT) pre-images from G06. Blue triangles: our data from the Swope Telescope at Las Campanas Observatory. H11 stars observed spectroscopically in this study are shown in red triangles (Swope data) and red dot (FORS2 data).
Current usage metrics show cumulative count of Article Views (full-text article views including HTML views, PDF and ePub downloads, according to the available data) and Abstracts Views on Vision4Press platform.
Data correspond to usage on the plateform after 2015. The current usage metrics is available 48-96 hours after online publication and is updated daily on week days.
Initial download of the metrics may take a while.