Fig. 10
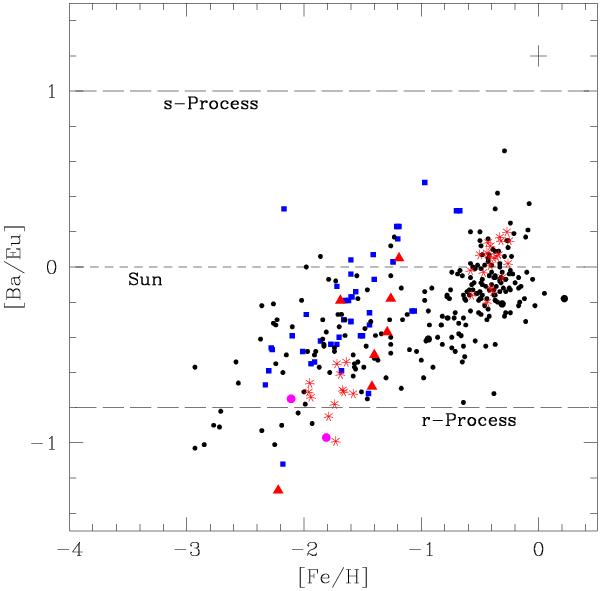
[Ba/Eu] ratio vs. [Fe/H] for H11 in magenta dots; Galactic data in black dots from McWilliam et al. (1995), Reddy et al. (2003, 2006), Burris et al. (2000), Fulbright (2000), blue squares are dSph data (Shetrone et al. 2001; Shetrone et al. 2003; Geisler et al. 2005), LMC data in red: triangles are J06, stars are old GCs from M10 and intermediate age clusters from Mucciarelli et al. (2008).
Current usage metrics show cumulative count of Article Views (full-text article views including HTML views, PDF and ePub downloads, according to the available data) and Abstracts Views on Vision4Press platform.
Data correspond to usage on the plateform after 2015. The current usage metrics is available 48-96 hours after online publication and is updated daily on week days.
Initial download of the metrics may take a while.