Fig. 5
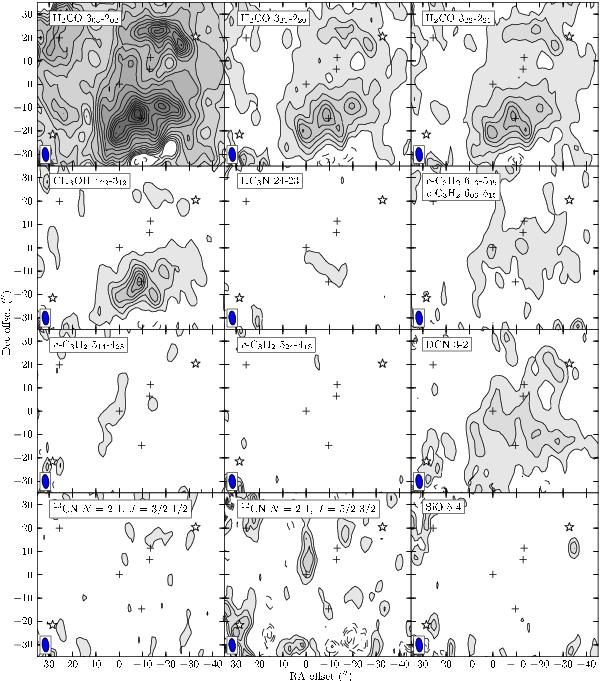
SMA/APEX integrated intensity line maps of all spectral lines in the SMA coverage except for 13CN N = 2–1, J = 5/2–3/2 (blend of several hyperfine transitions), which is barely detected in the interferometry data. The plotted 13CN line has the quantum numbers F1 = 1–0, F = 0–1. No APEX short-spacing data were used for the 12CN N = 2–1, J = 5/2–3/2 (blend of several hyperfine transitions) line. All contour levels are at a 3σ level at the edge of the primary beam. Refer to Table 4 for the exact contour levels and the integration intervals. Refer to Fig. 1 for a guide to the symbols used for the compact objects.
Current usage metrics show cumulative count of Article Views (full-text article views including HTML views, PDF and ePub downloads, according to the available data) and Abstracts Views on Vision4Press platform.
Data correspond to usage on the plateform after 2015. The current usage metrics is available 48-96 hours after online publication and is updated daily on week days.
Initial download of the metrics may take a while.