Fig. 14
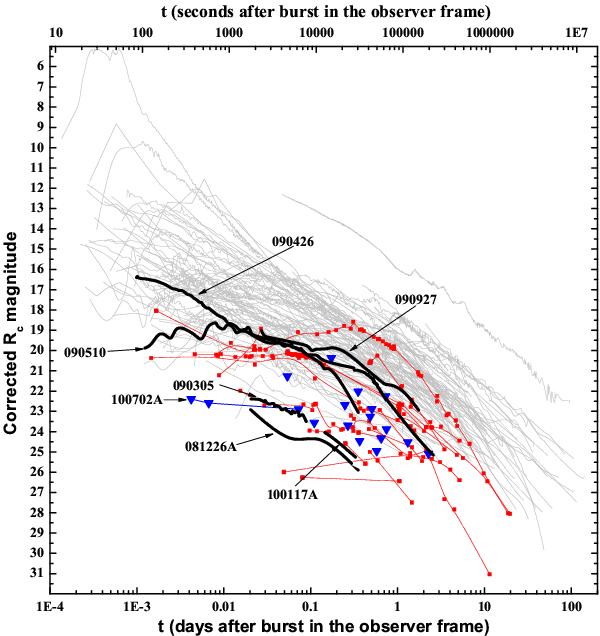
Light curves of long and short GRB afterglows. These light curves have been corrected individually for Galactic foreground extinction following Schlegel et al. (1998), and, if possible, for host galaxy contribution. The thin gray lines are the long GRB sample of Kann et al. (2010). The red squares connected by splines represent the afterglow detections reported by Kann et al. (2011). The short GRB afterglows detected by GROND and presented in Papers I and II as well as this work are given as labeled thick black lines (they may include additional data beyond the GROND detections). Upper limits presented in this work (Table 4) are given as blue triangles. GRB 100702A is highlighted also because of its very early upper limits. The last data point for GRB 100117A is from Fong et al. (2011), the other data points as well as the data for GRBs 090305 and 081226A are presented in this paper. Early data for GRB 090927 are taken from Klotz et al. (2009), Levan et al. (2009a), Cano et al. (2009), and Kuin & Grupe (2009).
Current usage metrics show cumulative count of Article Views (full-text article views including HTML views, PDF and ePub downloads, according to the available data) and Abstracts Views on Vision4Press platform.
Data correspond to usage on the plateform after 2015. The current usage metrics is available 48-96 hours after online publication and is updated daily on week days.
Initial download of the metrics may take a while.