Fig. 6
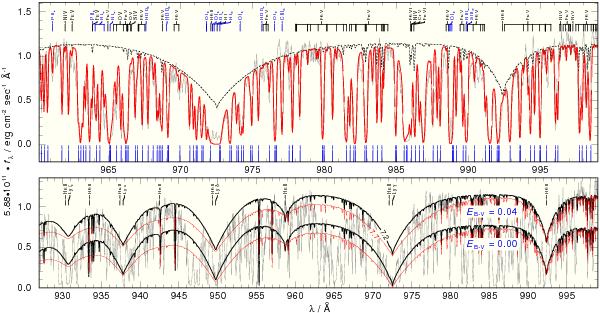
Top: section of the FUSE observation showing the necessity of a detailed modeling of the ISM. The dashed line is the final, pure photospheric model. The full (red) line shows a combined stellar and interstellar model. Blue marks at the bottom denote interstellar H2 absorption lines. Bottom: comparison of (pure photospheric) TMAP models with log g = 7.2 (thick, black) and log g = 7.7 (thin, red), normalized to the flux of the log g = 7.2 model at 999 Å for comparison. The full lines are calculated with the determined reddening of  (Sect. 2.1), the dashed lines (shifted in log fλ by − 0.4 for clarity) with
  .
.
Current usage metrics show cumulative count of Article Views (full-text article views including HTML views, PDF and ePub downloads, according to the available data) and Abstracts Views on Vision4Press platform.
Data correspond to usage on the plateform after 2015. The current usage metrics is available 48-96 hours after online publication and is updated daily on week days.
Initial download of the metrics may take a while.